
Introduction
Most Data Science roadmaps start with “learn Python, Pandas, ML…”, which means jumping straight into solutions while ignoring the big picture. Learners follow along but do not understand where the data flows or where the model fits, leading to fragmented knowledge. When facing real-world problems, they easily lose direction and become discouraged because they do not understand what problem they are actually solving. This blog takes the opposite approach: starting from the big picture, providing clear direction, and then diving into each specific component.
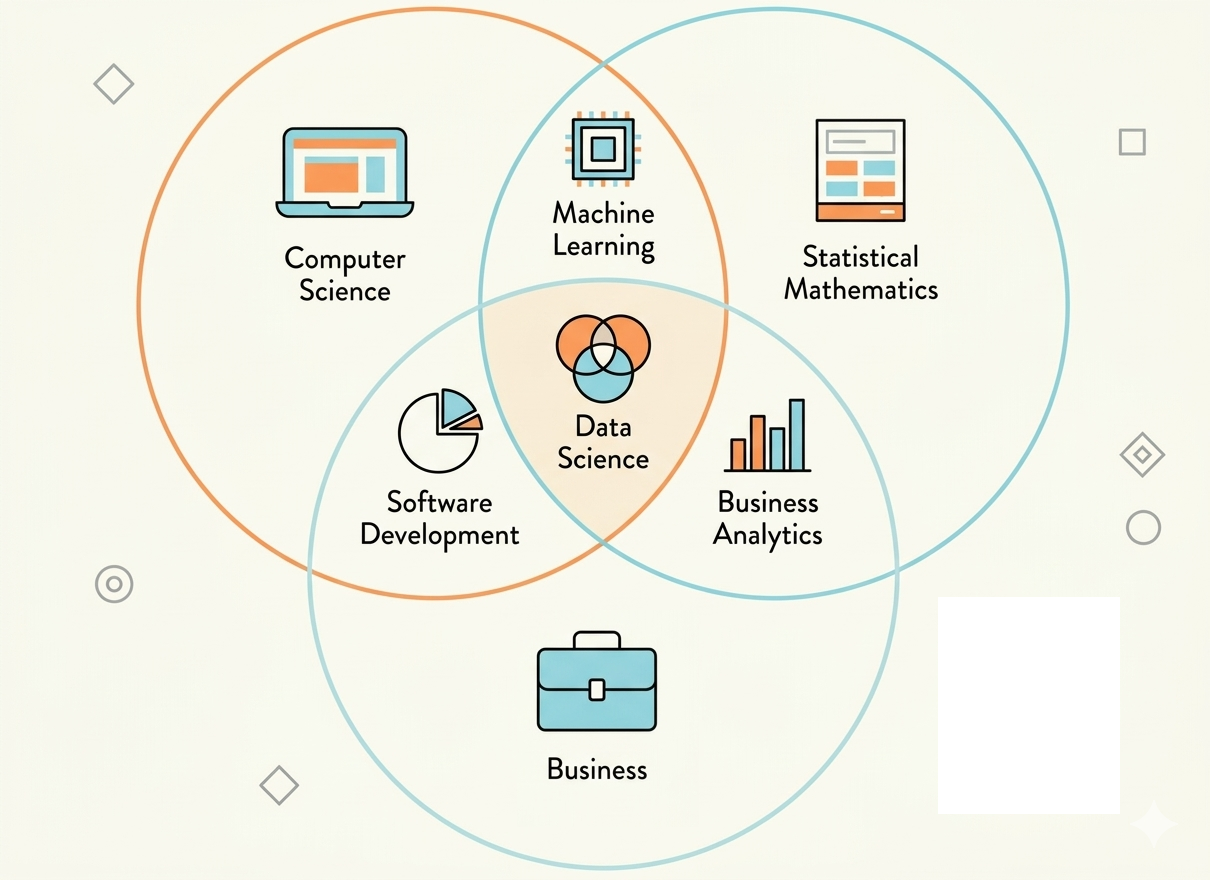
Source: Adapted from CodeLearn
1. How are the roles connected?
In a company environment, work and data become large and complex, making it difficult for a single person to handle everything. Therefore, collaboration between multiple roles is essential. Let’s go through each role in Data Science by considering a business problem (such as Spotify, Shopee, SaaS, etc.): “Predicting customer churn”.
1.1 Data Engineer - The “Data Pipeline” Builder
The first issues appear immediately:
Data is scattered across multiple sources (App logs | CRM, Marketing tools)
Data is dirty, inconsistent, missing, or incorrectly formatted ({02/01/2025, 2025-01-02}, NaN values)
Data updates and flows inefficiently
Data is not ready for business use
This is where Data Engineers come in. They will:
- Consolidate data from multiple sources into a centralized system
- Clean and standardize data
- Build automated pipelines (e.g., Kafka), manage data flow, and upload to the cloud (e.g., AWS services)
- Create “analytics-ready datasets”
1.2 Data Analyst - The “Data Storyteller”
Once the data is clean and accessible, a second problem appears:
No one knows what it is saying.
- What are the trends in revenue and traffic?
- Which customer segments are churning?
- What did the latest marketing campaign achieve?
These are business questions that need to be answered using data, and require someone who can read, analyze, and explain the results clearly to decision-makers. That is the role of the Data Analyst.
1.3 Data Scientist - The Future Predictor
However, analyzing the past has its limits. Knowing that 30% of customers churn every quarter is useful, but being able to predict who is about to churn and intervene in time is far more valuable.
This is where we go further—moving into analysis, prediction, and automation using machine learning models. That is the role of the Data Scientist.
1.4 Machine Learning Engineer - Turning AI into Products
This is where the final problem appears: the model has been built and works well on a Data Scientist’s machine, but cannot be deployed into real systems. A good model that cannot be used is essentially useless.
This is where ML Engineers come in and take responsibility for:
- Building APIs and handling workflows for tools (GPT, Whisper AI, Google Calendar)
- Scaling systems (AWS)
- Monitoring system performance and detecting failures
1.5 Overall Flow
Data Engineer → Data Analyst → Data Scientist → ML Engineer
      ↓              ↓               ↓                ↓
Clean Data  →   Insight    →     Model     → Real Product
2. The Right Roadmap: Foundations First, Specialization Later
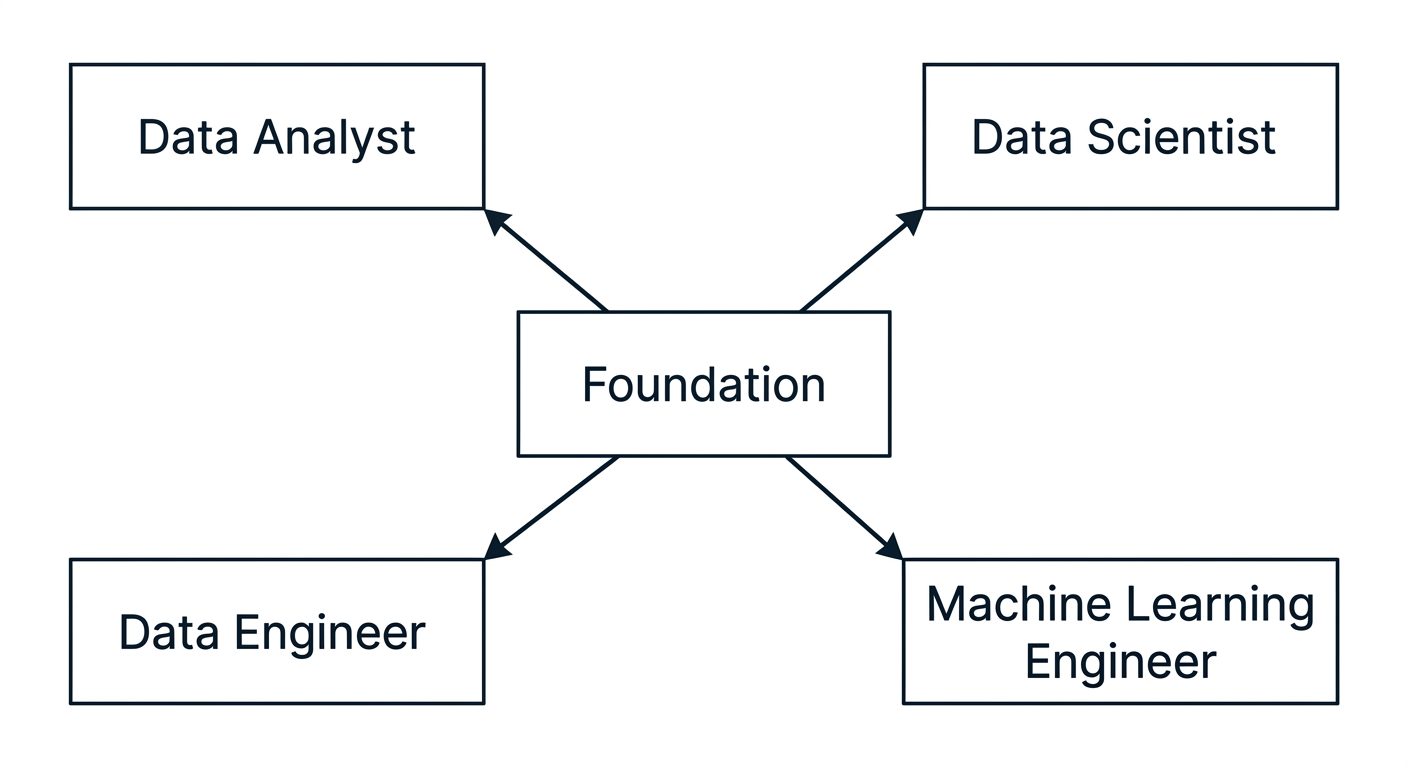
Source: AI-generated illustration.
2.1 Common Mistakes
People often choose a specific role too early and jump straight into Machine Learning without mastering foundational skills such as SQL or data processing. This leads to a misaligned learning process and gaps in core knowledge. In the long run, you may be able to build models but not truly understand the data, making it difficult to grow sustainably.
2.2 Start with Core Foundations
- Basic Python (the common language across AI-related fields)
- Basic SQL (a fundamental data language, suitable for beginners)
- Git (track progress, experiment with models, and enable CI/CD for teamwork)
- Data processing mindset (to apply the right steps based on your dataset and stage)
2.3 Overview of Each Role
After mastering the common foundation, the learning path in data begins to clearly branch out. Each role has a different focus, and choosing the right direction helps you avoid scattered learning.
-
Data Analyst (DA) focuses on advanced SQL, data visualization, and storytelling to turn raw numbers into meaningful insights.
-
Data Scientist (DS) goes deeper into statistics, machine learning, model evaluation, and feature engineering to solve predictive problems.
-
Data Engineer (DE) focuses on building data pipelines, working with Spark, Airflow, cloud systems, and data warehouses to ensure smooth data operations.
-
Machine Learning Engineer (MLE) focuses on deployment, Docker, APIs, MLOps, and monitoring to bring models into stable production environments.
Choosing the right path not only helps you learn more efficiently but also clearly defines the value you bring within a data system.
3. Choosing a Path: Which Role Fits You?
The next question is: which path should you choose? This is an important decision because it affects your entire learning journey and career direction from this point onward. Do not choose based on salary or because something is “trendy.” Choose based on your personality, genuine interests, and the long-term potential you can develop in that role (career growth, international exposure, market stability).
3.1 Key Questions
Answer the following four questions:
Question 1: Do you prefer working closer to the business side (reporting, presenting, explaining to stakeholders) or closer to technical systems (building pipelines, writing automated code)?
Question 2: Do you prefer quick results (dashboards, same-day reports) or are you willing to invest more time to build more complex products (models, systems)?
Question 3: Do you have a background in mathematics—probability, statistics, linear algebra? And do you enjoy it?
Question 4: Do you prefer working with the meaning of data (what the numbers represent) or the flow of data (where data comes from, where it goes, how fast or complete it is)?
3.2 Suggested Direction
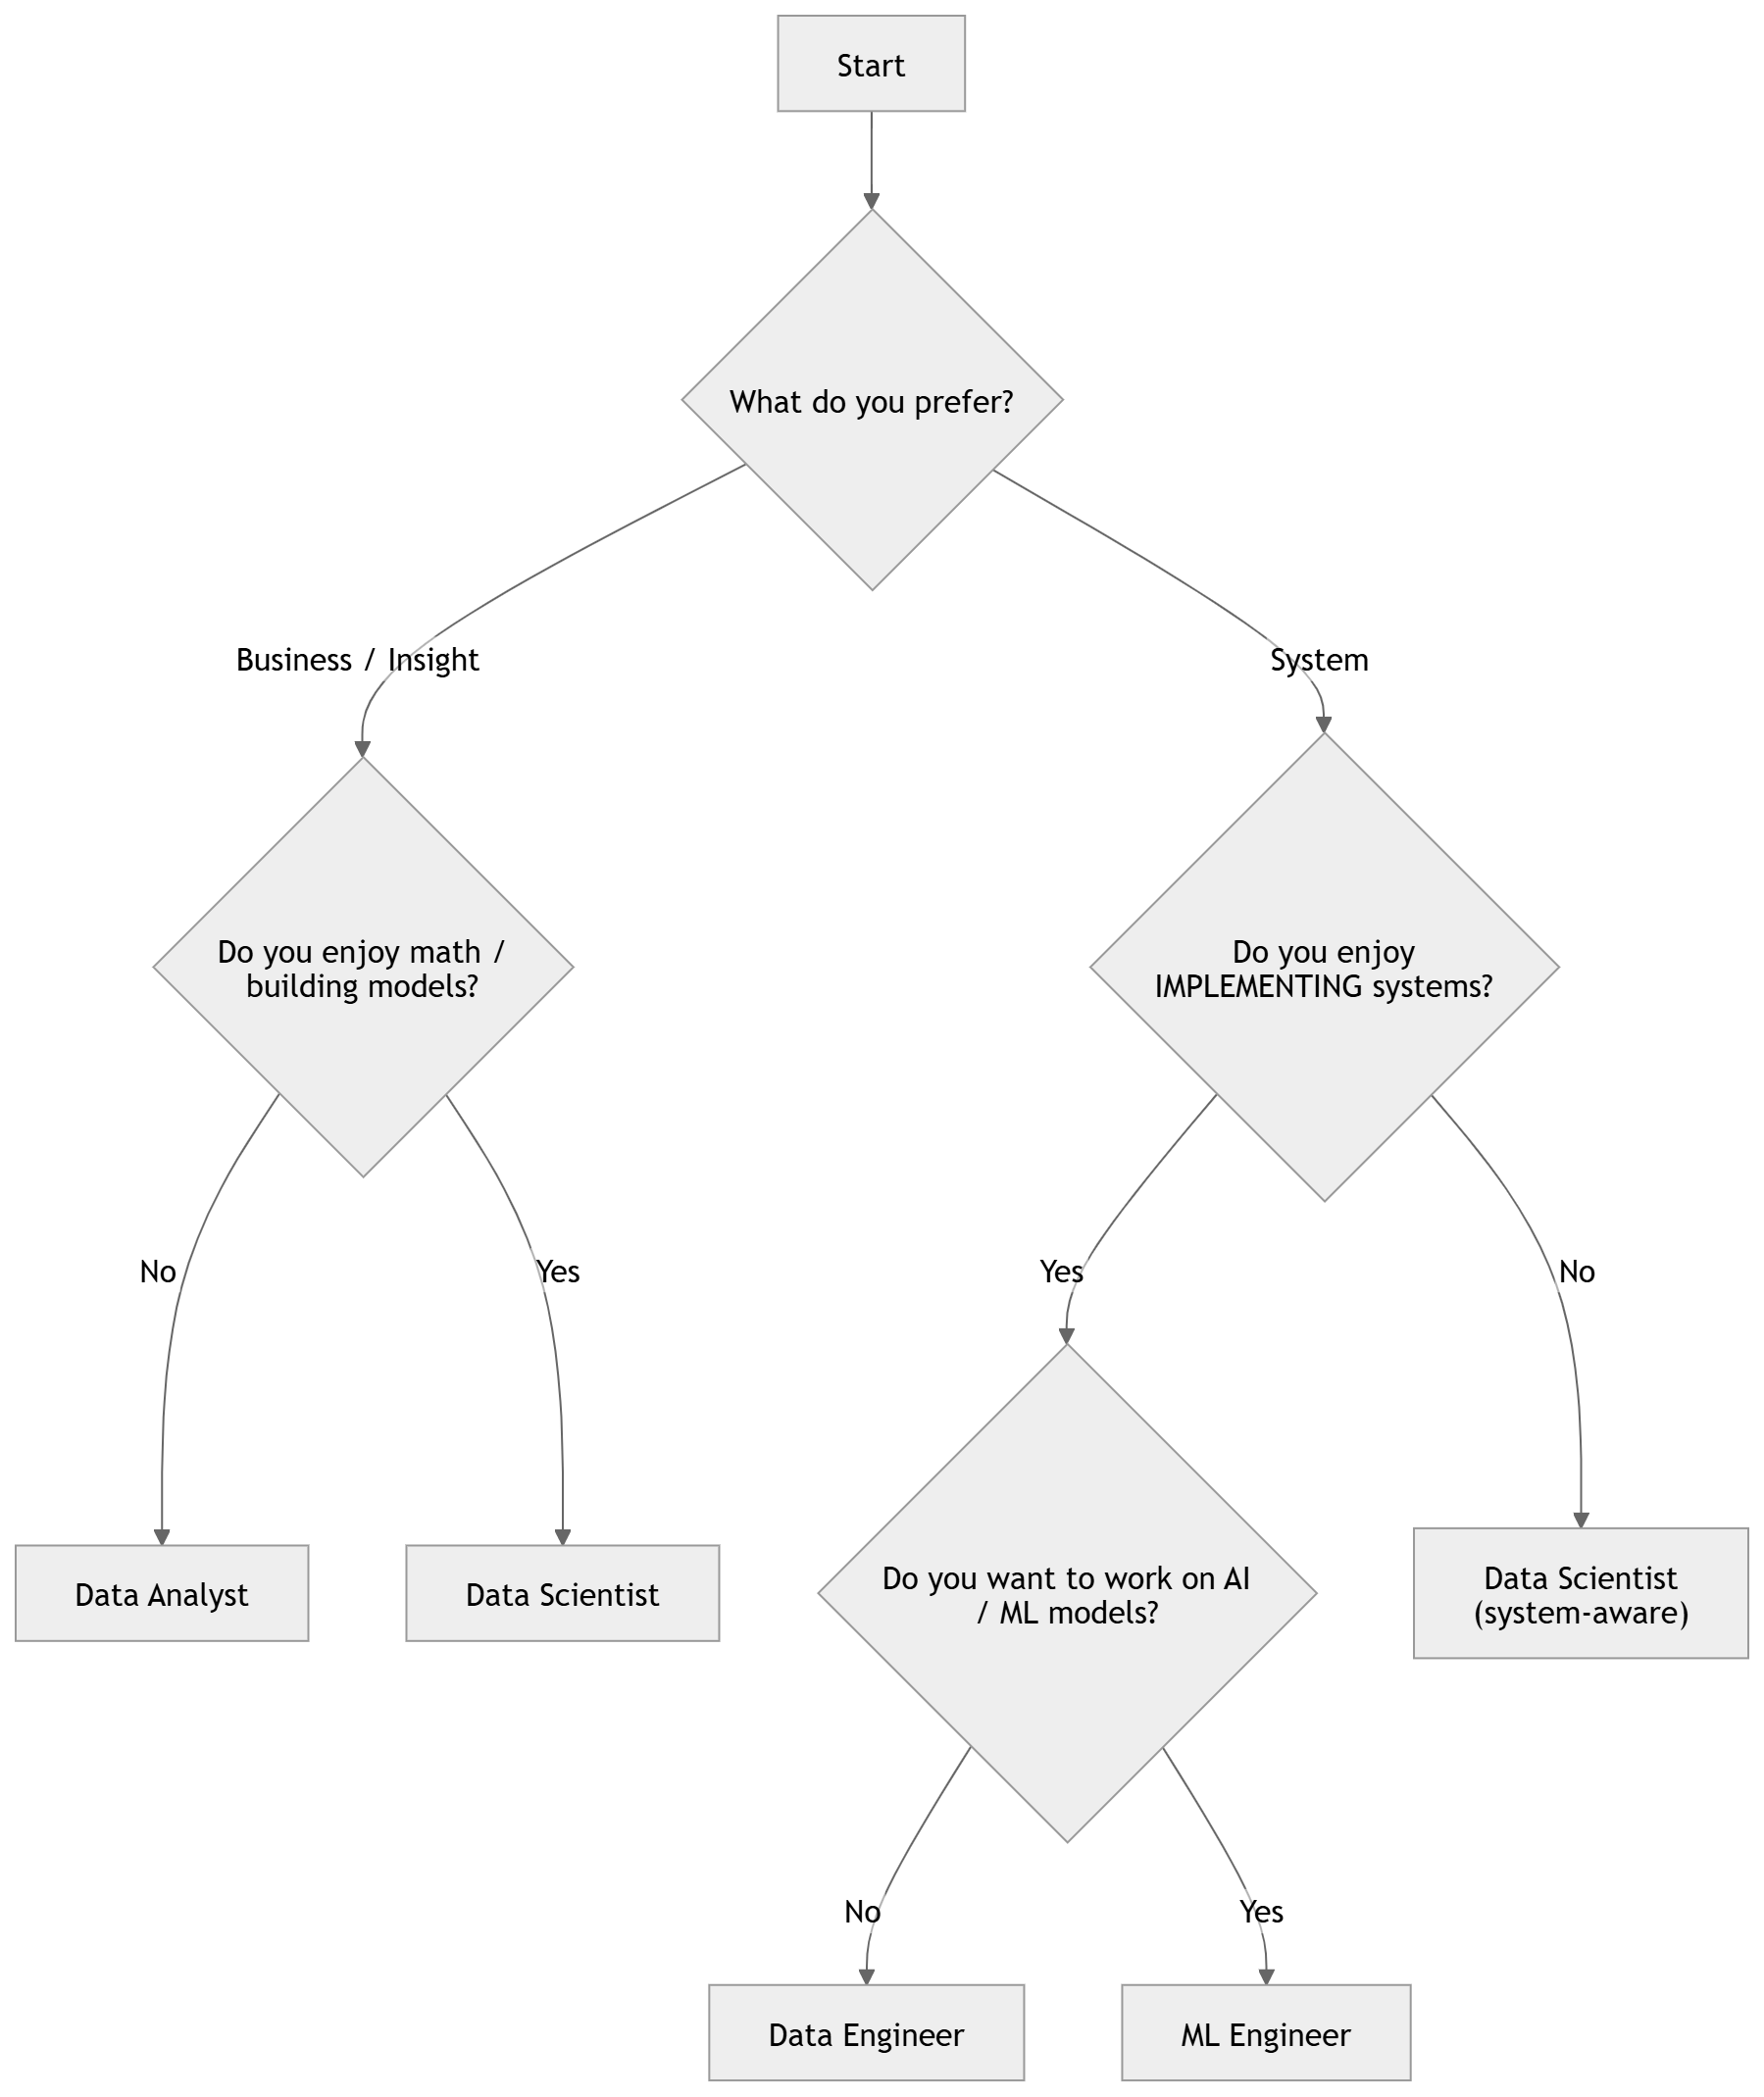
Source: AI-generated illustration.
Not sure yet? That’s fine. Start with Data Analyst—it is the easiest entry point, has the most overlap with other roles, and will help you understand what you enjoy after 2–3 months of real practice.
4. Detailed Roadmap for Each Role
4.1 Data Analyst
4.1.1 What does a Data Analyst do daily?
A Data Analyst does not spend the entire day processing data or building dashboards. While data is central, they constantly communicate with other teams to understand business problems and real-world requirements. From there, they work with data and present results to stakeholders to support decision-making.
4.1.2 Learning roadmap (in order):
Stage 1: Excel
When starting with data analysis, Excel is a suitable entry point for most people. With its ability to process and visualize basic data through simple operations, Excel is widely used across many organizations. Key things to learn:
- Important functions (SUM, MATCH, VLOOKUP, etc.)
- Power Query
- Pivot Tables
Source: AI VIET NAM.
Stage 2: Advanced SQL
In practice, data is rarely neatly organized. Basic SQL is only sufficient for the beginning. When handling more complex problems, you need more advanced SQL techniques such as:
| Technique Group | Commands / Components |
|---|---|
| Window Functions (Analytic) | ROW_NUMBER, RANK, LAG, LEAD, OVER |
| Aggregation (Group Functions) | GROUP BY, ROLLUP, CUBE, GROUPING SETS |
| Subqueries & Table Expressions | Subquery, CTE (WITH), EXISTS |
| Joins (Multi-table Queries) | INNER JOIN, LEFT JOIN, CROSS JOIN, SELF JOIN |
| Data Transformation | PIVOT, UNPIVOT, CASE WHEN |
Stage 3: BI Tools
“Reports are not for you.”
This is a key mindset every Data Analyst should have. A good report is not for the analyst to admire, but for others to understand and make decisions. Tools like Power BI and Tableau are designed for this purpose.
| Criteria | Power BI | Tableau |
|---|---|---|
| Cost | Affordable, accessible | More expensive |
| Modeling | Strong (DAX, structured model) | More limited |
| Data Processing | Includes Power Query (light ETL) | Flexible, fast interaction |
| Visualization | Sufficient | Very powerful, highly customizable |
| Best Use | Internal BI, Microsoft ecosystem | Advanced dashboards, storytelling |
Note: Focus on mastering one tool first (Power BI is more common in Vietnam). More importantly, learn to choose the right chart for the right question and present insights as a story rather than raw numbers.
Stage 4: Advanced Analytics
Applied Statistics
Statistical concepts such as mean, median, and standard deviation form the foundation for understanding and detecting data patterns. In addition, mastering advanced techniques such as t-test, chi-square, and A/B testing, along with interpreting p-values, transforms a Data Analyst from “reading data” to making data-driven conclusions and decisions.
A/B Testing
A/B Testing is a method for optimizing products by comparing a variation (B) against the original version (A) through experimentation and statistical analysis.
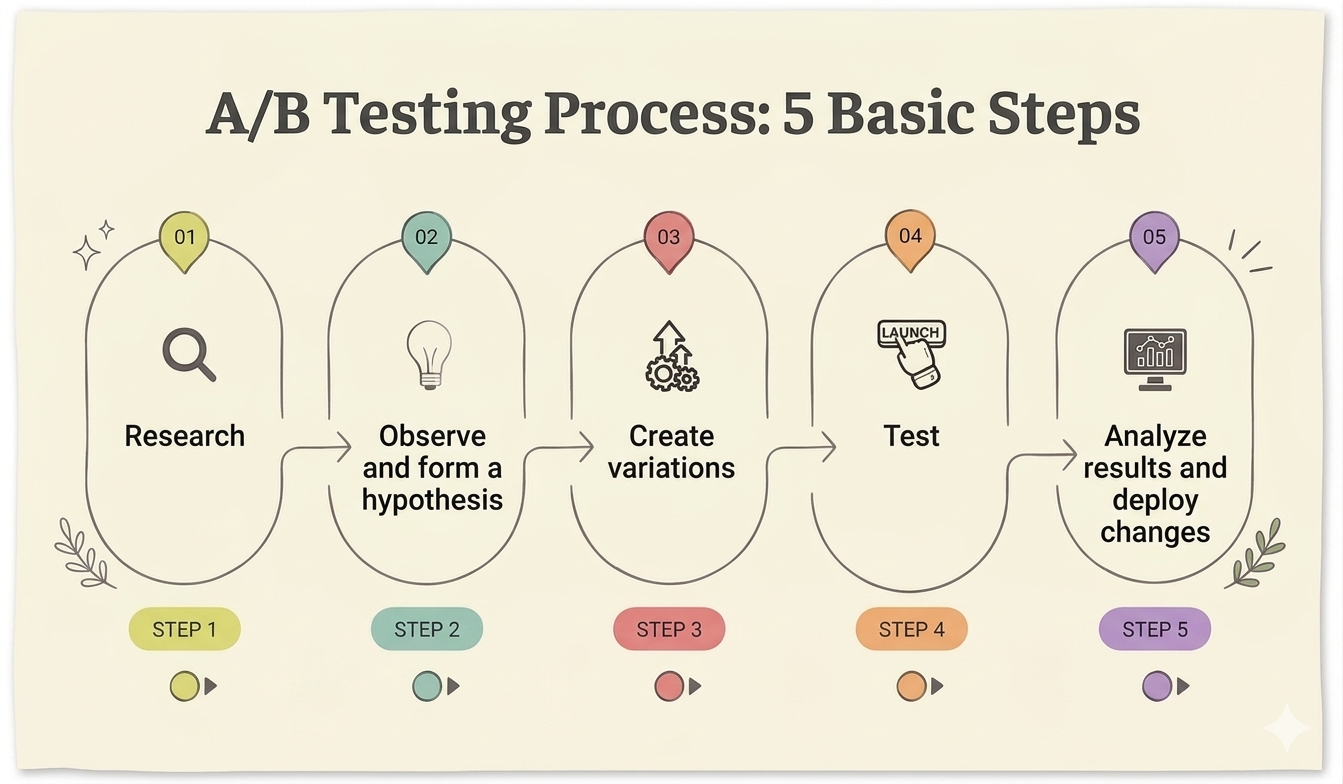
Source: Adapted from vwo.com
Stage 5: Business Analytics
A strong Data Analyst does not just build reports or dashboards, but can translate data into the business language of an organization. Business metrics and behavioral analysis techniques are the foundation for this.
Behavioral Analysis Techniques
In practice, Data Analysts often use techniques such as Cohort Analysis, Funnel Analysis, and Segmentation to understand users and support decision-making.
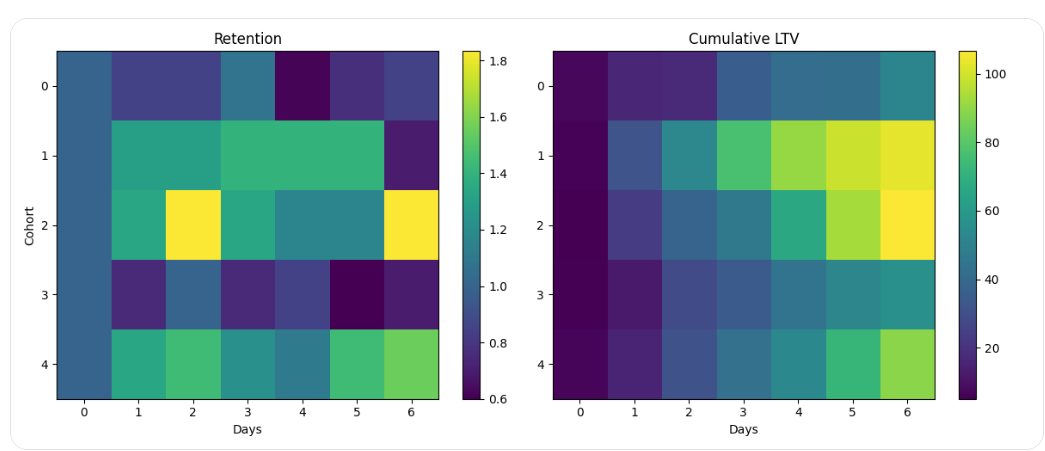
Source: AI-generated illustration
Business Metrics
- Metrics: Measurable indicators of a company’s performance
- KPI: The most important metrics for the company
- OKR: Objectives + metrics (KPIs) used to measure progress
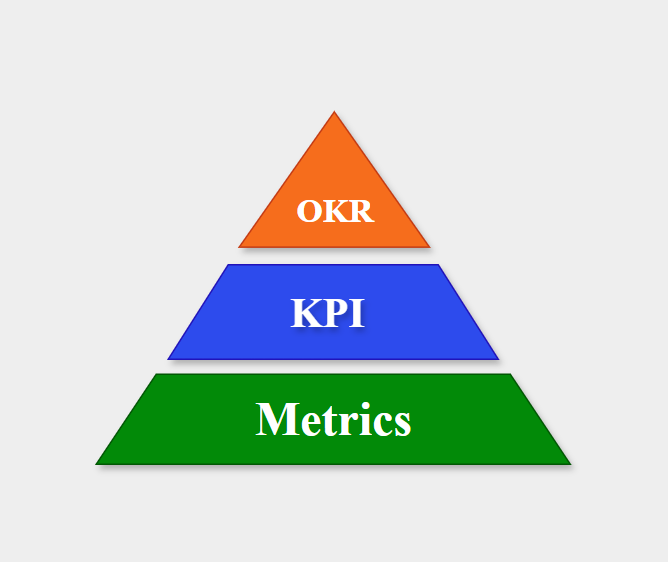
Source: Compiled by the author
4.1.3 Real-world Projects
- Project 1: Analyze the Superstore dataset on Kaggle — identify 3 meaningful business insights, build a Power BI dashboard, and write a one-page report with actionable recommendations.
- Project 2: Design and analyze an A/B test — simulate data in Python or use an existing dataset, perform a chi-square test, and write conclusions for a Product Manager.
4.2 Data Scientist
4.2.1 What does a Data Scientist do?
A Data Scientist’s work typically revolves around collaborating with Data Analysts and other Data Scientists. They take insights from DA, translate them into machine learning problems, build models, and report results.
4.2.2 Learning roadmap (in order):
Stage 1: Probability and Statistics Foundations
Probability and statistics form the foundation of data science. Every machine learning algorithm and predictive model relies on them. Many people skip this step and jump directly into ML without understanding why models work.
Stage 2: Basic Machine Learning
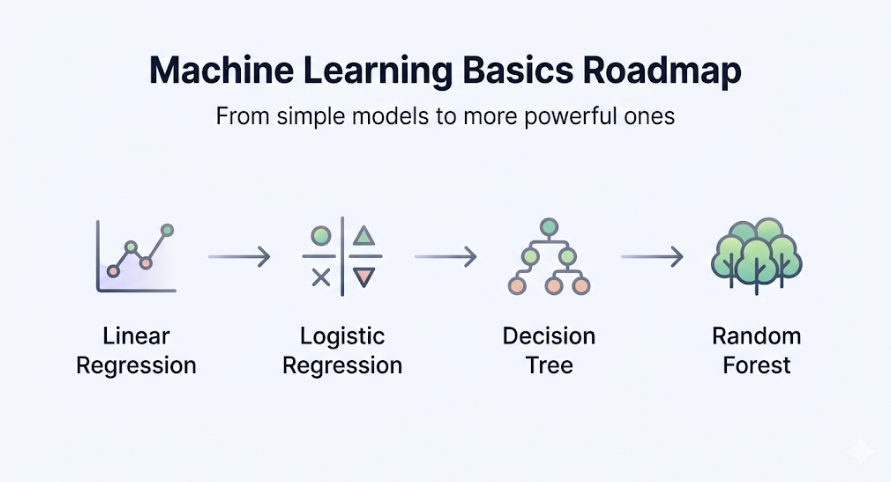
Source: AI-generated illustration
For each algorithm, you need to understand three things: what problem it solves, how it works intuitively, and when to use it compared to other algorithms.
Stage 3: Model Evaluation and Improvement
A model that runs is not necessarily a good model. Therefore, Data Scientists use various techniques to evaluate and improve models, as even small mistakes can have significant real-world consequences.
| Topic | Concept | Key Idea |
|---|---|---|
| Evaluation | Cross-validation | Evaluate model by splitting data into multiple folds |
| Model Behavior | Overfitting / Underfitting | Model memorizes or fails to learn |
| Metrics | Accuracy / Precision / Recall / F1 / AUC-ROC | Performance metrics depending on the problem |
| Optimization | Hyperparameter tuning (Grid, Random, Bayesian) | Optimize parameters to improve performance |
Stage 4: Boosting and Feature Engineering
Boosting
Boosting is a technique that combines multiple models, where each subsequent model corrects errors from the previous one. Models like XGBoost and LightGBM often perform very well on tabular and time-series data.
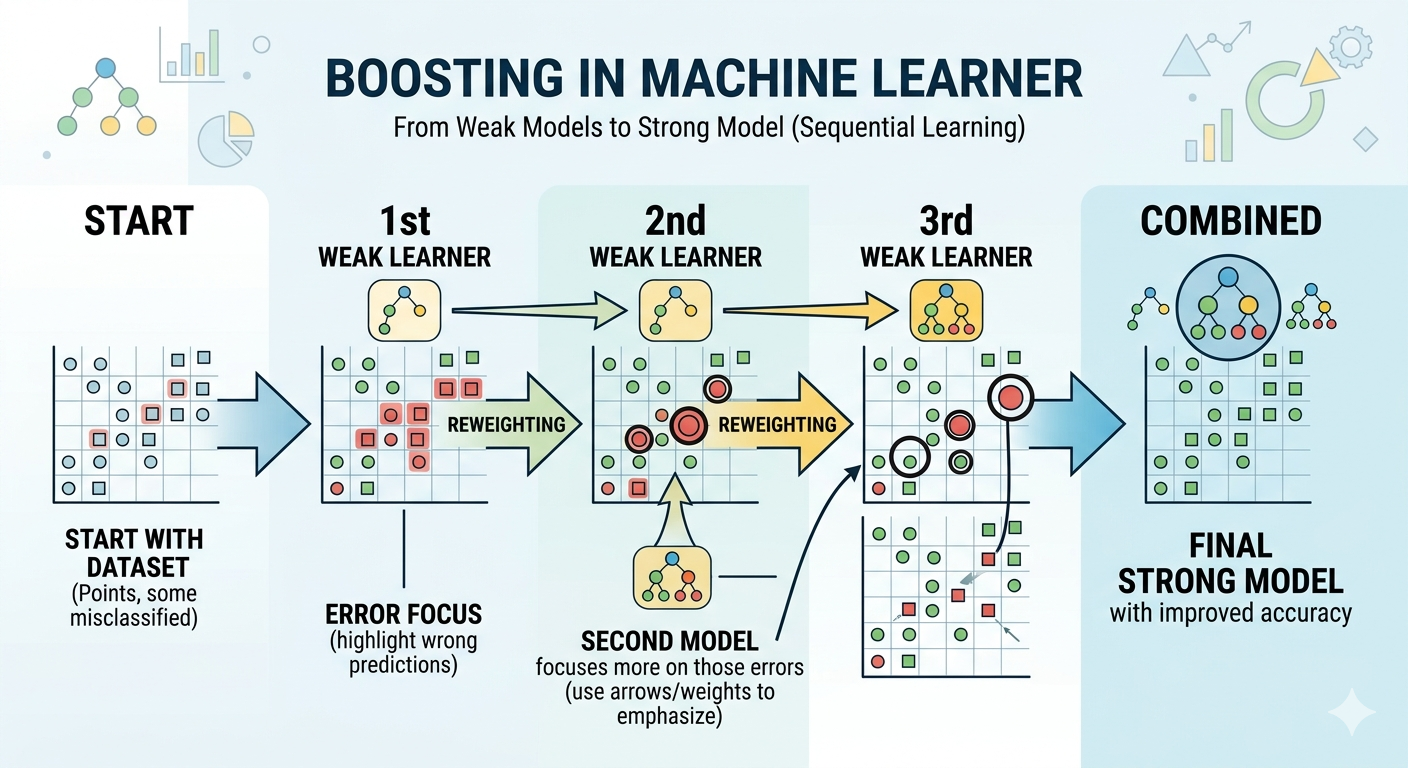
Source: AI-generated illustration
Feature Engineering
Feature engineering is the process of designing and selecting features that help machine learning models perform better.
Common techniques include:
- Feature Transformation
- Feature Creation
- Feature Selection
- Feature Extraction
Stage 5: Model Interpretability
Explainable AI
LIME and SHAP are methods used to answer the question: “Why did the model produce this result?”. They ensure reliability and fairness, which are critical for real-world ML applications.
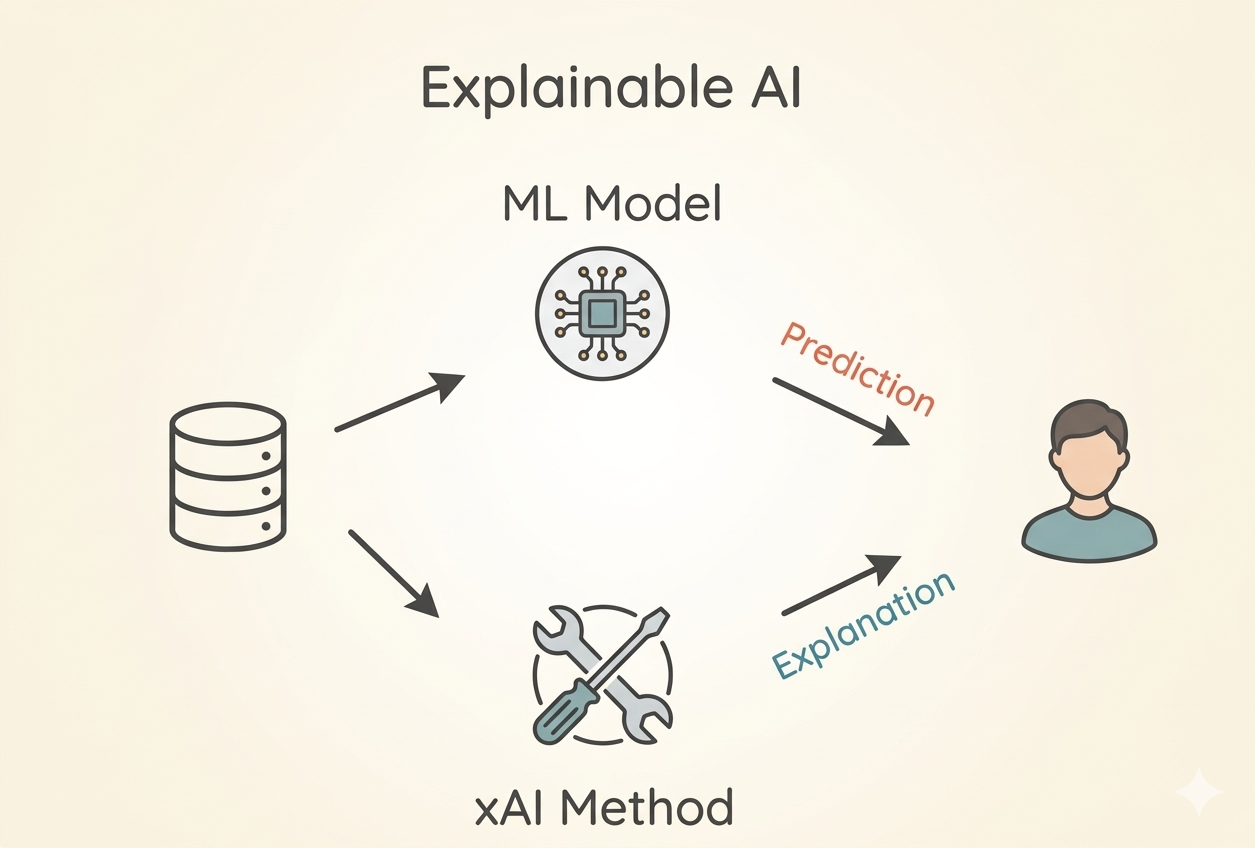
Source: AI-generated illustration
Additionally, learning causal inference is recommended to determine whether observed results are causal or coincidental.
4.2.3 Real-world Projects
-
Project 1: Build a house price prediction model with a full pipeline, compare at least 3 algorithms using cross-validation, use SHAP for interpretation, and write a README like a technical report.
-
Project 2: Participate in a Kaggle competition (winning is not required), analyze and understand the top 10% solutions after the competition, and write a comparison between their approach and yours.
4.3 Data Engineer
4.3.1 What does a Data Engineer do daily
On a daily basis, Data Engineers design and build systems to collect, process, and store large volumes of data. In addition, DEs also need to work with DA and DS to understand what data they need and prepare it for them.
4.3.2 Learning roadmap (in order)
Stage 1: Advanced SQL and database
For Data Engineers, SQL is not only for writing queries but also for building and optimizing databases. Learning advanced and system-level SQL techniques is mandatory for DEs.
| Technique | Purpose | Explanation |
|---|---|---|
| Indexing, Query Optimization | Speed up queries | Optimize data structures and query statements. |
| Data Modeling (Star / Snowflake) | Make queries easier and faster | Organize data in a structured way. |
| Transactions | Ensure consistency | Group multiple steps into one. |
| ACID | Ensure data correctness | A set of rules that keep the database consistent and reliable |
Stage 2: Python for Data Engineering
DEs use Python not only for modeling like DS, but to build data processing systems. To do that, DEs need to master the following:
- Working with files and handling large files
- Working with APIs – requests library (GET, POST, PUT, DELETE, etc.)
- Logging for debugging pipelines
- Config management (env variables, YAML)
Note: Code of a DE should not only run, but also be well-structured, stable, easy to debug, and easy to operate.
Stage 3: Data pipeline and Orchestration
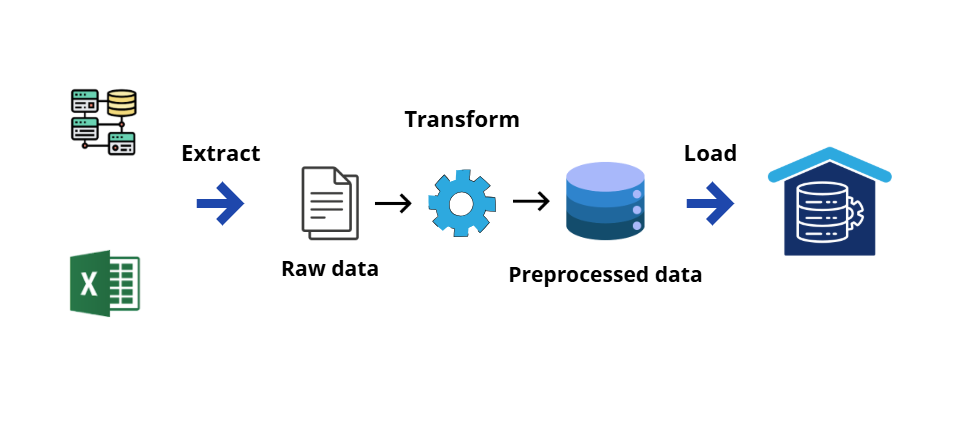
Source: Adapted from AI VIET NAM
Pipeline is a process that is consistent, repeatable, and reliable. Key knowledge in this stage includes:
- ETL and ELT pipelines
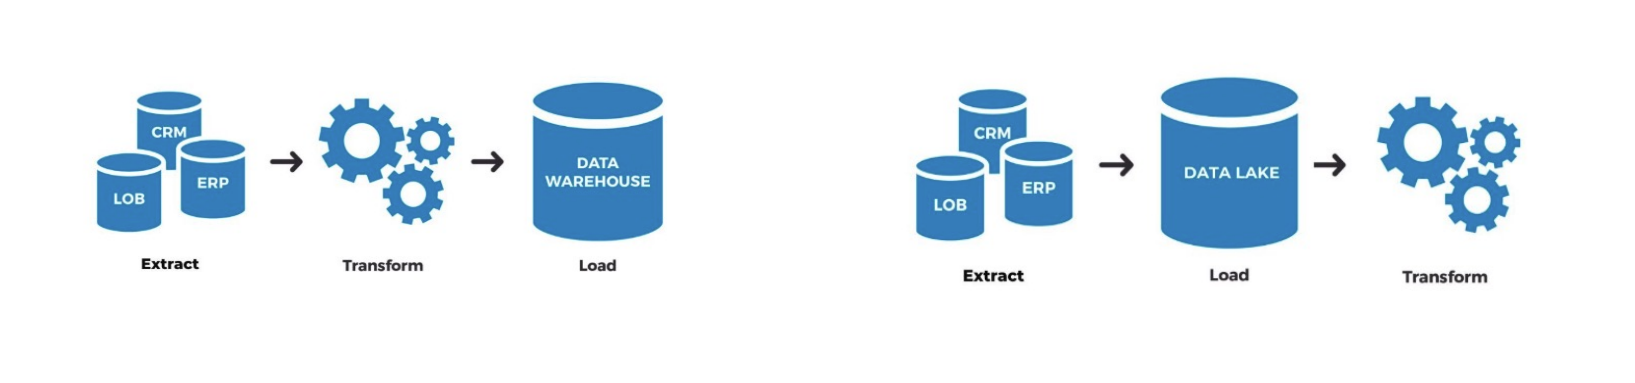
Source: AI VIET NAM
- Transform data using SQL in the warehouse (use dbt)
- DAG (Directed Acyclic Graph), Scheduling, Idempotency, orchestration, alerting automation (use Apache Airflow)
- How to write data quality checks
Stage 4: Cloud and distributed computing
Source: AI VIET NAM
Recently, companies tend to move data systems to the cloud. This requires DEs not only to "build pipelines" but also to design and operate end-to-end data systems on cloud platforms (AWS or GCP).
Suggestion: Learners should choose one platform: AWS, GCP, or Azure to go deeper. Basic concepts include: storage (S3/GCS), compute (EC2/Compute Engine), and data warehouse (Redshift/BigQuery).
4.3.3 Real-world projects
-
Project 1: Build an end-to-end pipeline — get data from a public API (e.g., weather API or GitHub API), clean it, transform using dbt, store in PostgreSQL or BigQuery, schedule with Airflow to run daily, and include alerting when it fails.
-
Project 2: DataTalks.Club Data Engineering Zoomcamp has a very practical capstone project — recommended because of community support and review.
4.4 ML Engineer
4.4.1 What does an ML Engineer do daily
On a daily basis, ML Engineers are responsible for bringing models into production:
- Packaging models into APIs
- Building CI/CD pipelines
- Adjusting and optimizing data workflows
At the same time, they collaborate with Data Scientists to understand model requirements and with Data Engineers to ensure input data is correctly formatted.
4.4.2 Learning roadmap (in order)
Stage 1: Software engineering fundamentals for ML
MLEs need to write better code than Data Scientists — not just “working code” but code that is readable, maintainable, and testable. Specifically:
| Skill | Purpose |
|---|---|
| OOP | Clean, reusable code |
| Testing | Prevent bugs when changing code |
| Virtual environment | Avoid library conflicts |
| Project structure | Easier to manage and scale |
| Logging | Easier debugging and monitoring |
Typical project structure:
project/
├── README.md
├── requirements.txt
├── src/
│   ├── ingestion/
│   ├── processing/
│   ├── models/
│   └── utils/
├── data/
│   ├── raw/
│   └── processed/
├── tests/
└── scripts/
In short, MLE work is closer to Software Engineering, so code quality is extremely important.
Stage 2: Machine learning
MLEs do not need deep theoretical knowledge like Data Scientists, but must understand:
- What the model takes as input and produces as output
- How the model behaves with real-world data (missing values, distribution shift, edge cases)
Also need to recognize common deployment issues:
| Issue | Description |
|---|---|
| Training–serving skew | Training and production data differ |
| Wrong feature version | Using incorrect data version |
| Data leakage | Leakage during training |
| High latency | Slow model inference |
| Serialize/deserialize | Errors when saving/loading model |
Stage 3: MLOps
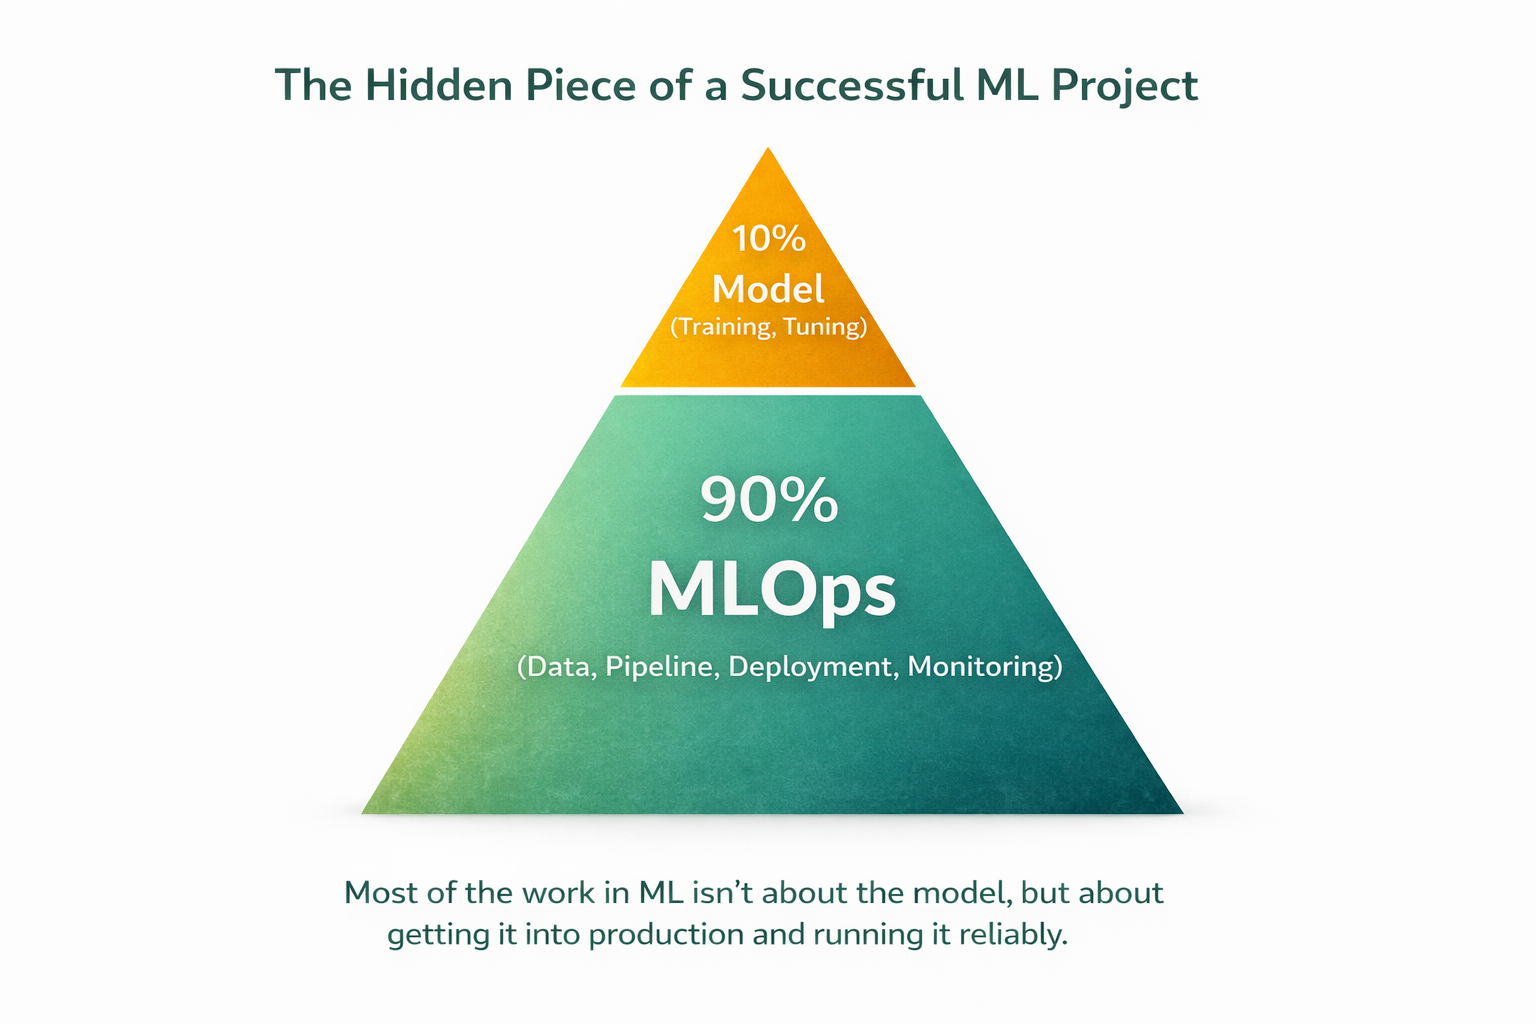
Source: AI-generated illustration
MLOps is the combination of DevOps principles with Machine Learning workflows. It bridges research models and real-world systems. MLOps determines about 90% of a project's success, while the model itself is only 10%.
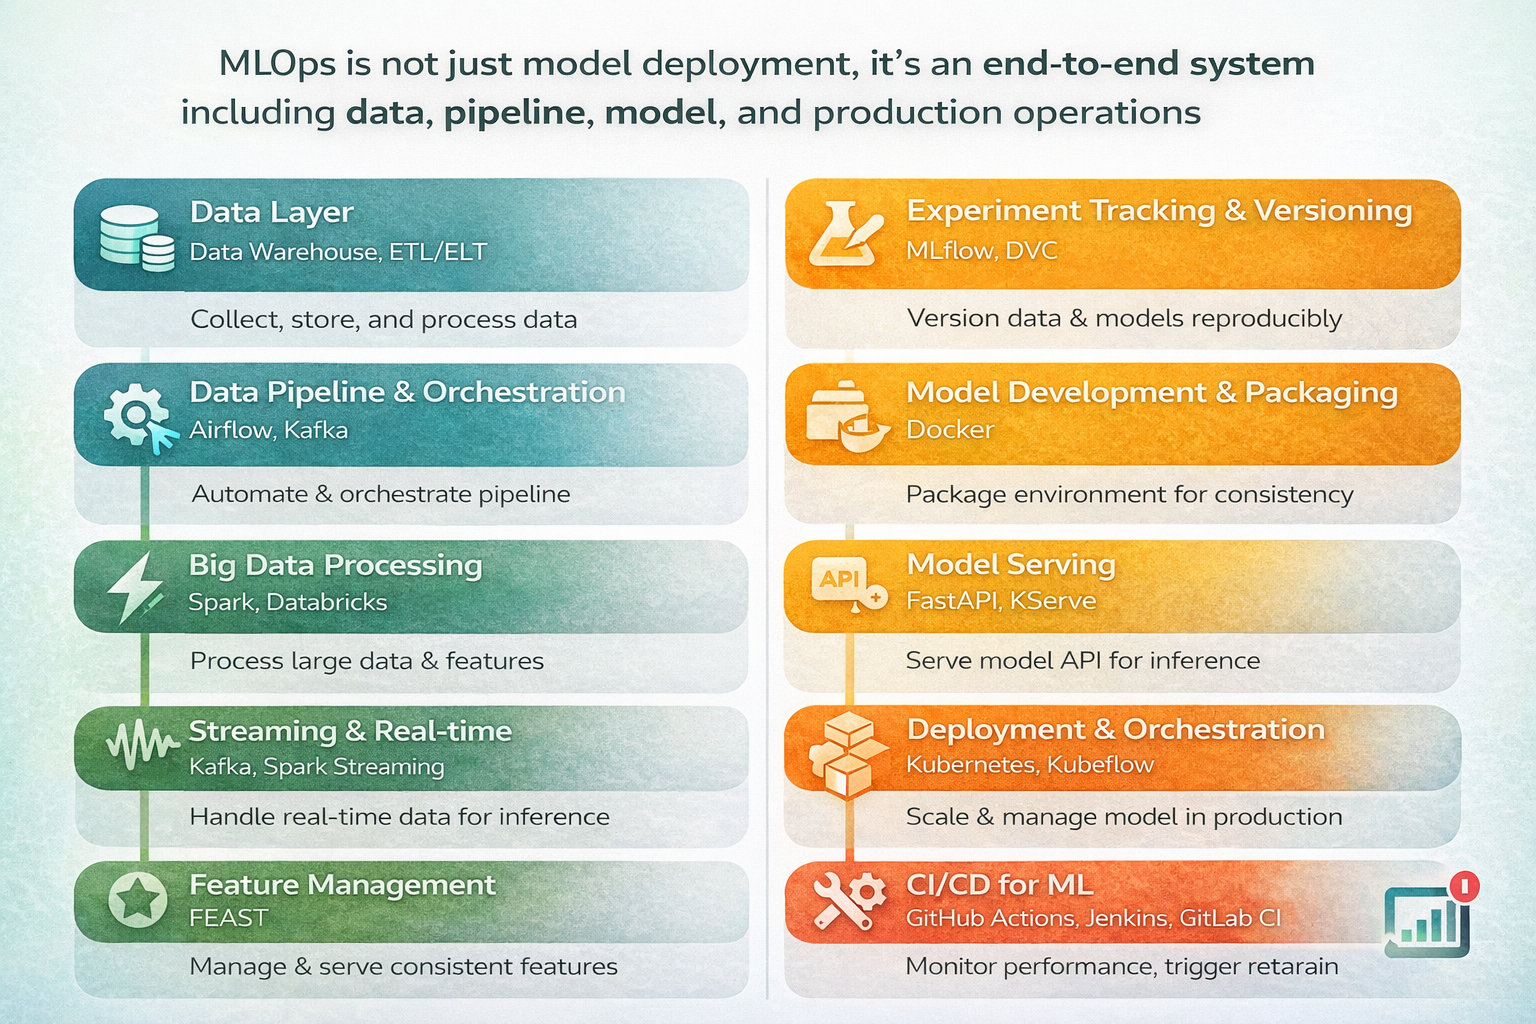
Source: AI-generated illustration
Suggestion: MLOps is broad and requires significant time. Learn it step by step.
Stage 4: Cloud deployment
When data becomes large and models more complex, companies often move to cloud for compute, storage, and scalability. Therefore, cloud knowledge is essential for MLEs.
| Category | Knowledge | Purpose | Example |
|---|---|---|---|
| Compute | VM (CPU/GPU) | Train model, run inference | EC2, GCE |
| Storage | Object storage | Store datasets, models, logs | S3, GCS |
| Database | SQL / data warehouse | Store processed data, features | BigQuery, RDS |
| Networking | Public IP - Port | Connect services | Expose API via VM + open port |
| IAM (Security) | User roles | Basic permission control | AWS IAM |
| Monitoring | Logs & metrics | Track errors and performance | CloudWatch, Stackdriver |
4.4.3 Real-world project
- Project: Take a model built by a Data Scientist (e.g., house price prediction), wrap it with FastAPI, containerize with Docker, deploy on Render, set up GitHub Actions for automatic deployment on push. The result is a public URL that anyone can call.
5. Real-world observations
5.1 Blurring skill boundaries
The general trend is that roles are becoming more hybrid, and companies expect more from individuals. Continuous learning and expanding knowledge is essential.
5.2 Soft skills are increasingly important
“Communication is the foundation of everything”
In the workplace, you will frequently interact with product, business, data, and engineering teams. Asking the right questions, clarifying requirements, and presenting results clearly are as important as building models.
5.3 System thinking
AI can now write code very well, so the advantage is no longer in coding speed or syntax knowledge, but in understanding the big picture: the problem, the data flow, and how the system operates. Instead of learning tools or models superficially, focus on system thinking — breaking down problems and designing clear pipelines.
Conclusion
Learning AI/Data is not a short-term race but a long-term accumulation process. Instead of chasing multiple trends, focusing on a clear direction, building strong fundamentals, and continuously going deeper will bring better long-term results. The difference lies not in how much you know, but in how deeply you understand and apply it.
References
Cherian, M. (2026, February 27). A/B testing guide. VWO. https://vwo.com/ab-testing/
roadmap.sh. (n.d.). AI Engineer roadmap: Step-by-step guide to becoming an AI engineer. https://roadmap.sh/ai-engineer
Nguyễn, T. H. M., Trần, T. K., Nguyễn, Q. H., Đinh, N. K., & Nguyễn, T. M. (2026).
Overview of MLOps: Technologies, tools, and processes for effective ML deployment.
https://aioconquer.aivietnam.edu.vn/posts/toan-canh-mlops-cong-nghe-cong-cu-va-quy-trinh-trien-khai-ml-hieu-qua
AI Vietnam. (2025). AIO 2025 – Module 3, 4 & 5 course materials.
Chưa có bình luận nào. Hãy là người đầu tiên!