
Blog by group CONQ026 — Warm Up 02
Introduction
In this article, we'll walk through the complete picture: what Data Science is, what the work actually looks like day-to-day, what a standard project process looks like, and how the roles in the field truly differ from one another. No complex jargon, no dry theory, just the things that are genuinely useful.
1. What is Data Science - and where is it in the AI landscape?
Before understanding what Data Science is, let's clarify 4 concepts that most beginners confuse: AI, Machine Learning, Deep Learning, and Data Science.
Looking at the diagram below, you'll notice something interesting right away: Data Science does not sit inside AI, it's its own circle, with overlapping areas but completely independent.
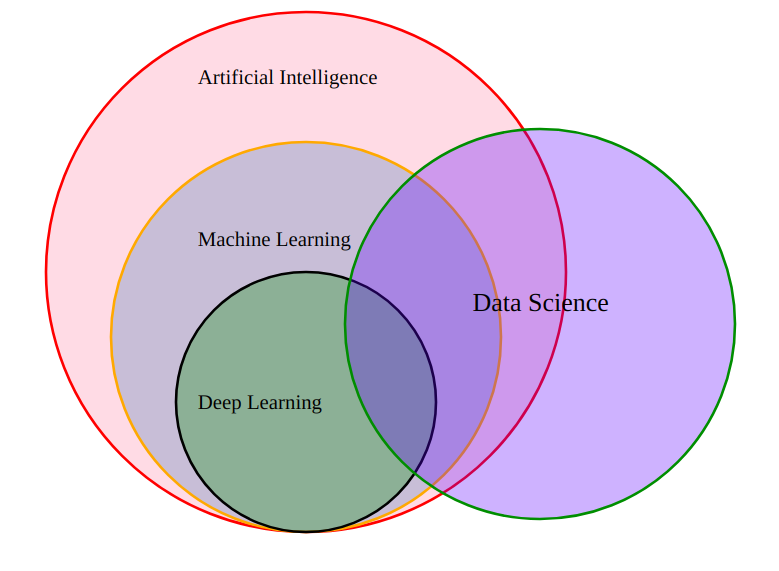
- Artificial Intelligence (AI) - The largest circle
AI is the broadest field, with the goal of simulating human intelligence so that computers can think, learn, and make decisions on their own. Everything below it, ML and Deep Learning, falls within AI.
- Machine Learning (ML) - Inside AI
ML is a branch of AI. Instead of hard-coding every rule, ML allows computers to learn on their own from data. For example: instead of writing code that says "if an email contains the word 'promotion' then it's spam", ML learns to recognize spam on its own after seeing thousands of email samples.
- Deep Learning (DL) - Inside ML
DL is a branch of ML that uses multi-layered neural networks to tackle more complex problems like facial recognition, language translation, or image generation. This is the technology behind ChatGPT, Midjourney, and the generative AI models you see today.
- Data Science - An independent circle
Data Science does not sit inside AI. Data Science is a field that combines mathematics, statistics, programming, and domain knowledge to collect, process, and analyze data, with the goal of uncovering valuable insights and making better decisions.
DS overlaps with ML and DL, because a Data Scientist can use ML/DL as analytical tools. But a skilled Data Scientist can create enormous value without ever touching Deep Learning, relying solely on statistics, SQL, and the ability to tell stories with data.
The table below summarizes the differences between all four concepts:
| AI | Machine Learning | Deep Learning | Data Science | |
|---|---|---|---|---|
| What is it? | Simulates human intelligence | Machines learn from data | ML using multi-layer neural networks | Extracts insights from data |
| Goal | Automate thinking | Predict from patterns | Solve complex problems | Support decisions with data |
| Tools | ML, DL, Rule-based... | Scikit-learn, XGBoost | PyTorch, TensorFlow | SQL, Python, Tableau, R, statistics |
| Example | Self-driving cars, chatbots | Spam filter, movie recommendations | Facial recognition | Revenue analysis, churn prediction |
2. What does the actual work in Data Science look like?
Because Data Science is inherently interdisciplinary, a Data Scientist's work spans a wide range of tasks - from data collection and data processing to analysis and visualization. These tasks form a pipeline that transforms raw data into meaningful insights.
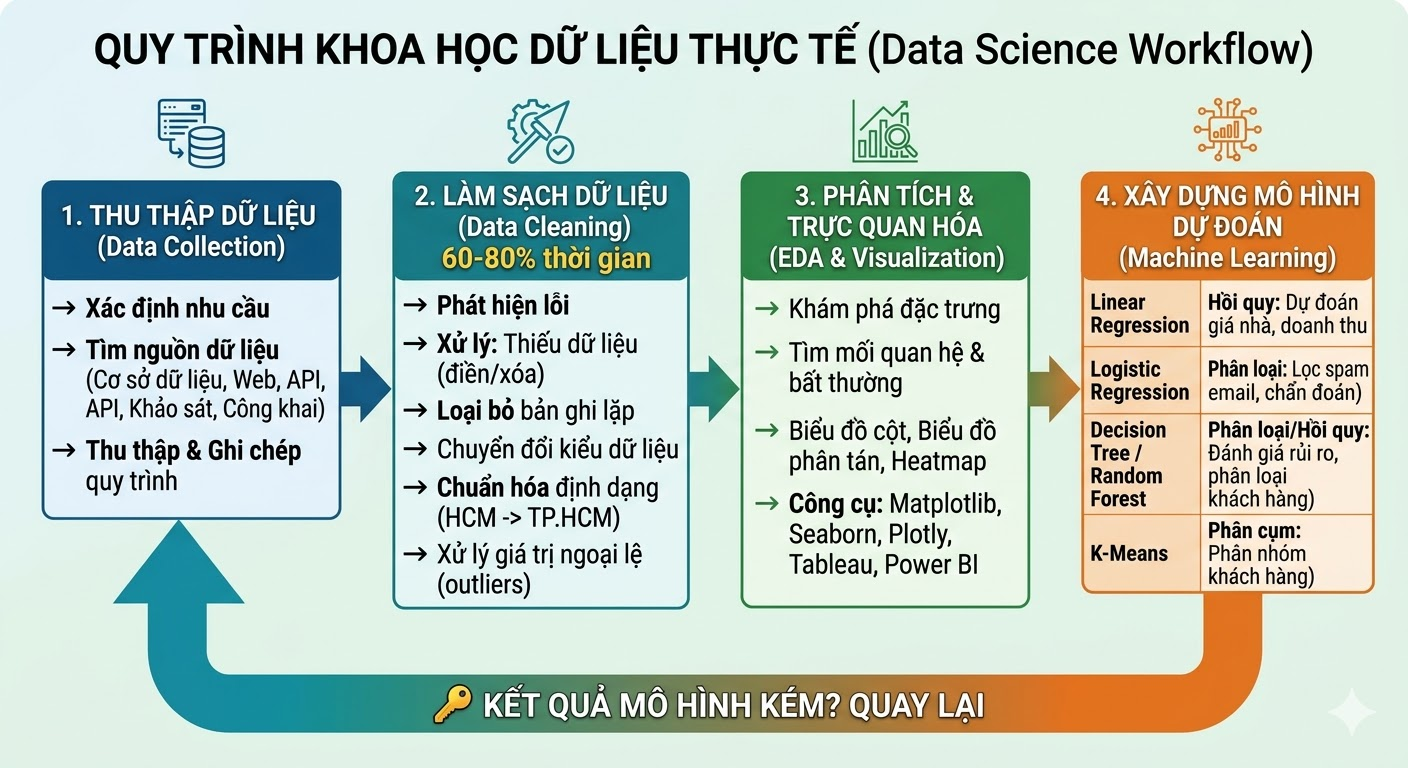
2.1. Data Collection
The golden rule of the field: "Garbage In, Garbage Out." Poor input data means unreliable results, no matter how sophisticated the algorithm.
Collecting data well means knowing clearly what you need, where to get it, and documenting every step carefully. Data sources can include internal databases, web scraping, APIs, user surveys, or publicly available datasets.
2.2. Data Cleaning
This is the part that never gets mentioned in Data Science marketing materials, yet it's the most time-consuming step - typically accounting for 60% to 80% of total project time.
Real-world data is always messy. Missing values, duplicate records, inconsistent formatting ("HCM", "Ho Chi Minh", "HCMC", three ways to write the same thing), and outliers that skew results. All of it must be detected and handled before any analysis can begin.
| Common Error | Description | How to Handle |
|---|---|---|
| Missing data | Empty values or unrecorded entries | Fill with mean/median, or remove the record |
| Duplicate records | A record appears multiple times | Remove duplicate entries |
| Wrong data type | Numbers stored as text strings | Convert to the correct data type |
| Inconsistent format | Same information written in different ways | Standardize to a unified format |
| Outliers | Values far too large or small compared to the rest | Detect and handle: remove or cap the value |
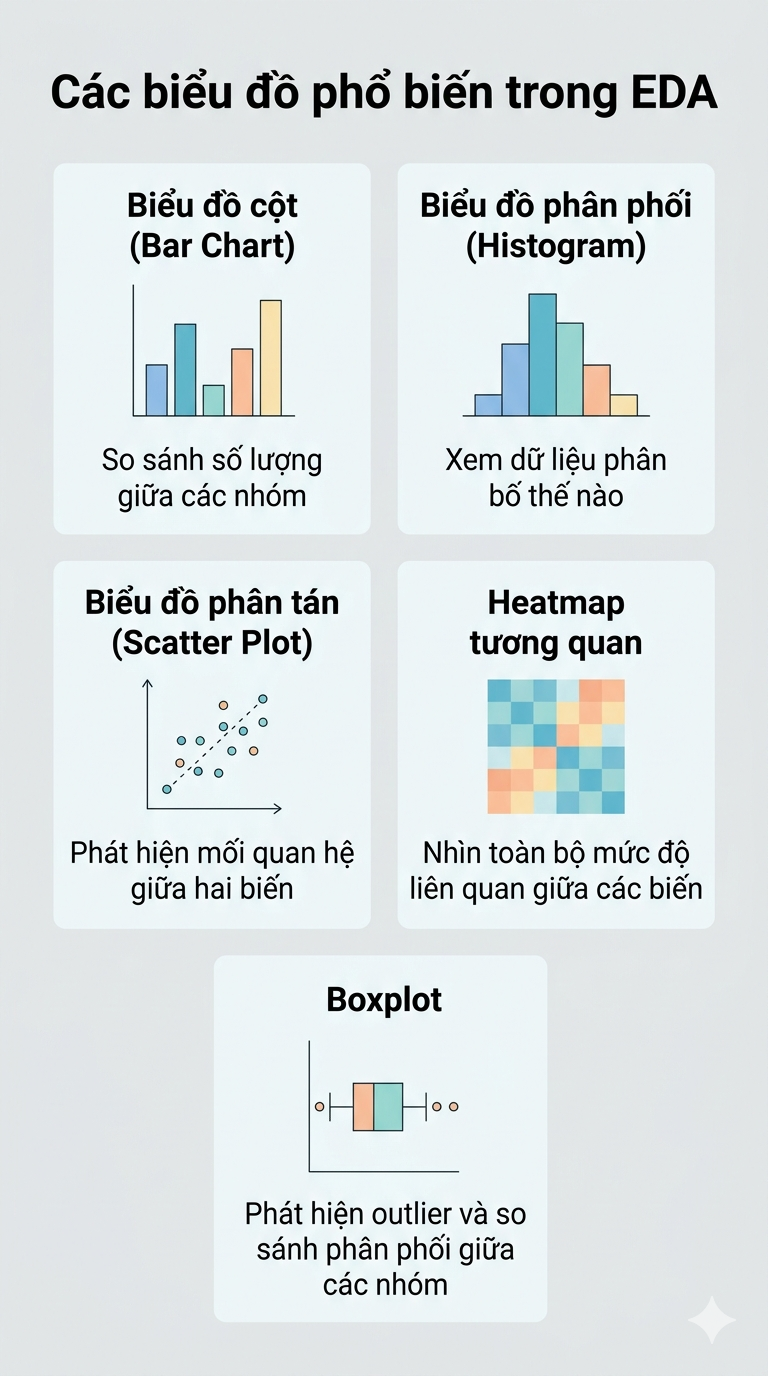
2.3. Exploratory Data Analysis & Data Visualization
Once the data is clean, it's time to start "reading" it. Exploratory Data Analysis (EDA) is the process of understanding the characteristics of your data, how it's distributed, how variables relate to each other, and whether any anomalies remain.
In EDA, you'll be looking to answer questions like:
-
How is the data distributed? Is it skewed or balanced?
-
Are there correlations between variables? Which ones influence the target variable?
-
Are there any outliers that slipped through the Cleaning step?
-
Are there any interesting patterns or trends hidden in the data?
Visualization is the primary tool of EDA. Each chart type lets you see the data from a different angle, as illustrated in the figure below:
2.4. Building Predictive Models (Machine Learning)
This is the step most people think of first when they hear "Data Science", but in reality, it takes up only a small fraction of total project time. Commonly used ML algorithms include:
| Algorithm | Problem Type | Real-world Application |
|---|---|---|
| Linear Regression | Regression | Predicting house prices, revenue, temperature |
| Logistic Regression | Classification | Spam filtering, disease diagnosis |
| Decision Tree | Classification / Regression | Credit risk assessment, customer segmentation |
| Random Forest | Classification / Regression | Combines multiple trees to improve accuracy |
| K-Means | Clustering | Grouping customers by purchasing behavior |
🔑 Key takeaway
These four steps are not a straight line — they form a loop. Poor model results may send you back to clean more data, or collect new data entirely. This is the real nature of the work.
3. The standard Data Science project process: CRISP-DM
Knowing the techniques isn't enough, you also need to know how to organize a project so it actually solves the business problem. That's why CRISP-DM exists.
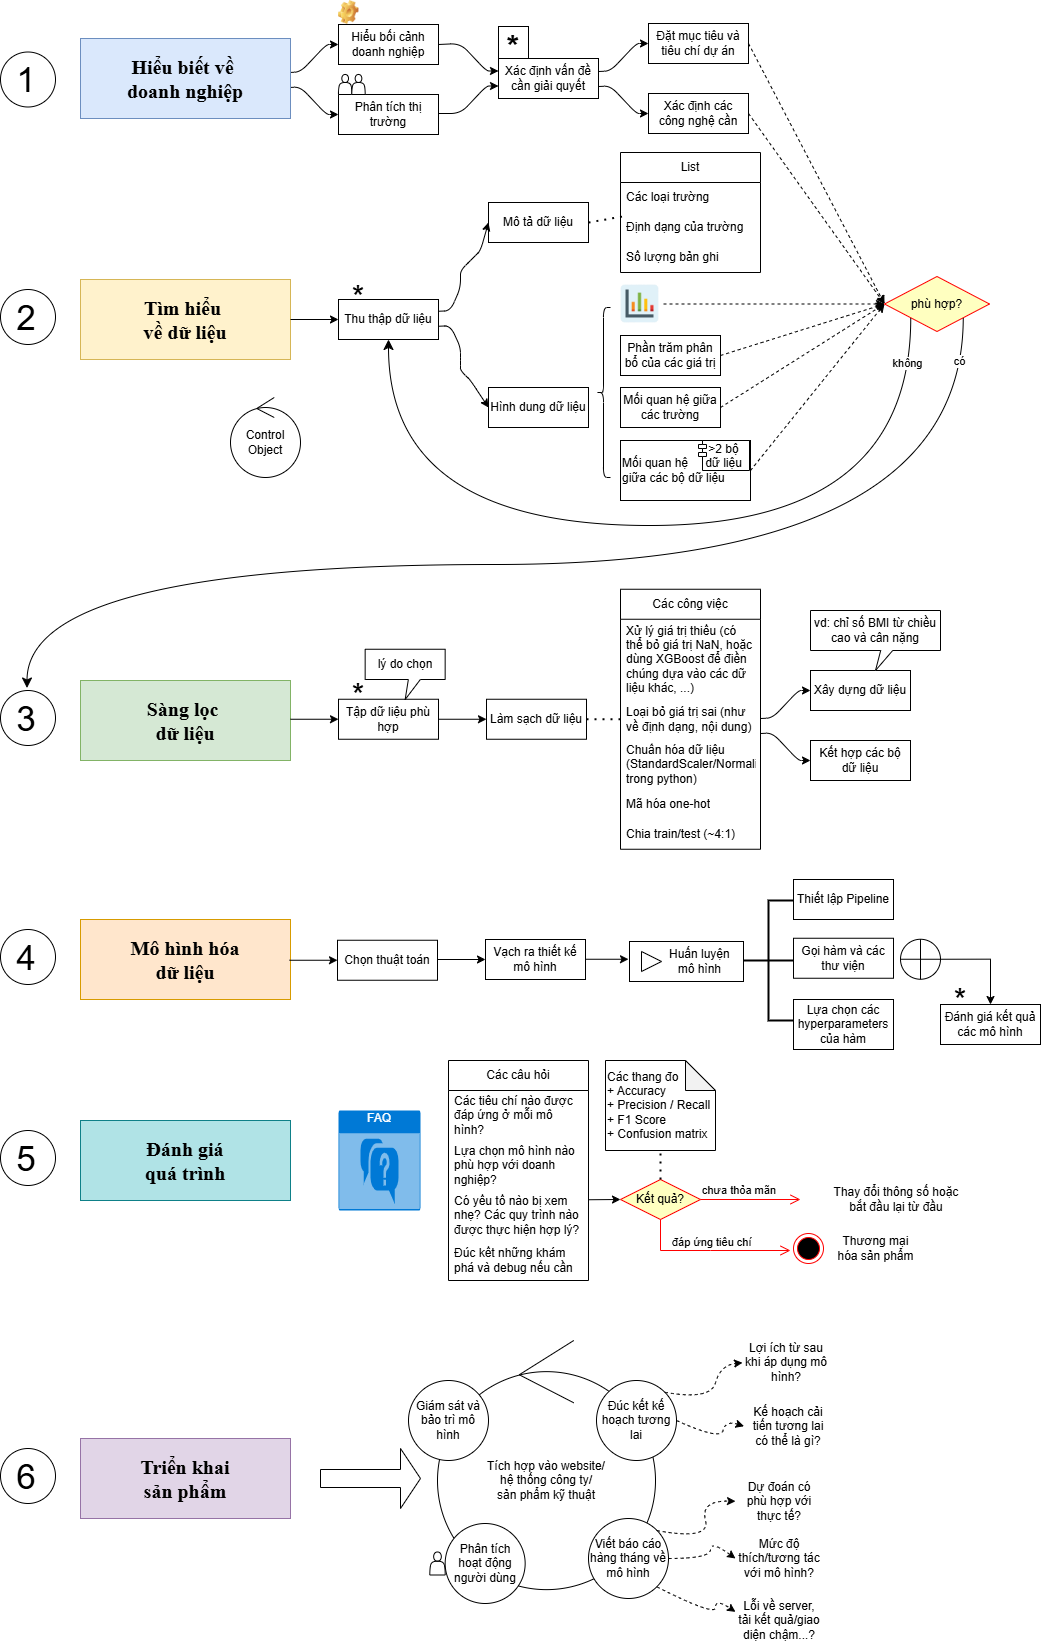
CRISP-DM (Cross-Industry Standard Process for Data Mining) is the most widely used industry-standard process for executing Data Science and Machine Learning projects. It was developed in 1996 by a consortium including Daimler, SPSS, and NCR.
It consists of 6 sequential stages: understanding the business problem, understanding and preparing the data, building the model, evaluating results, and deploying the product. The process is iterative - if results don't meet expectations, you loop back to earlier stages to improve.
| Step | Stage | What you do here |
|---|---|---|
| 1 | Business Understanding | Define project goals, KPIs, constraints, and success criteria |
| 2 | Data Understanding | Collect data, initial exploration, identify early issues |
| 3 | Data Preparation | Clean, normalize, feature engineering - the most time-consuming step |
| 4 | Modeling | Choose algorithms, train and tune the model |
| 5 | Evaluation | Assess whether the model actually solves the original business problem |
| 6 | Deployment | Integrate into production, monitor performance, plan for improvement |
4. Roles in the Data field - Which one suits you?
In a data or AI project, no one does everything alone. Each role is a link in the chain from raw data to business decision. Here's the full picture:
4.1. Overview of the 5 core roles
| Role | Core Responsibilities | Output | Tools & Skills |
|---|---|---|---|
| Data Analyst | Analyze data · Visualize · Report to support decisions | Dashboard · Reports · Insights | SQL · Excel · Power BI / Tableau |
| BI Analyst | Track KPIs · Build automated reporting systems · Detect anomalies | KPI Dashboard · Automated strategic reports | Power BI · Tableau · SQL · Qlik |
| Data Scientist | Build predictive models · Deep analysis · Hypothesis testing | ML Models · Forecasting algorithms · Correlation analysis | Python · R · Scikit-learn · PyTorch · SQL |
| Data Engineer | Build data pipelines · Manage storage infrastructure · Ensure data quality and security | Pipeline · Data Warehouse / Data Lake | Spark · Kafka · Airflow · Docker · Cloud |
| ML Engineer | Deploy models to production · Build CI/CD for ML · Monitor and optimize performance | Model API · MLOps Pipeline · Stable AI services | Docker · Kubernetes · Cloud · MLOps |
4.2. The 3 roles you should understand first
4.2.1. Data Analyst (DA)
DA is the bridge between data and decision-makers. They use SQL to extract data, Python or Excel to analyze it, and Power BI or Tableau to turn dry numbers into stories that leadership can understand and act on.
- Real-world example: A fashion chain notices a sudden drop in revenue in March. The DA investigates, queries the data, and discovers: revenue fell mainly in winter clothing because warm weather arrived earlier than usual that year. They then recommend launching the summer collection ahead of schedule - a decision driven directly by data.
4.2.2. Data Scientist (DS)
DS goes further than DA by building models capable of predicting the future. They need a stronger foundation in mathematics and statistics, and typically work more deeply with machine learning algorithms.
If a DA answers "Why did revenue drop last month?", a DS answers "Which customers are most likely to churn in the next 3 months?"
- Real-world example: A bank wants to reduce lending risk. The DS builds a credit scoring model based on transaction history, age, and occupation of millions of past customers. When a new applicant submits a loan request, the model automatically calculates a risk probability and supports the bank's decision in just seconds.
4.2.3. Data Engineer (DE)
If DS and DA are the "users" of data, DE is the one who makes sure that data exists, is clean, and is ready to use. They build pipelines that automate the collection, processing, and storage of data at scale.
- Real-world example: A food delivery app has thousands of drivers moving constantly. The DE builds an automated pipeline to collect driver GPS coordinates every second, filter out bad data, and load it into the data warehouse - so the DS can immediately use it to calculate estimated delivery times for millions of orders per day.
Summary table of the 3 core roles:
| Role | Main Responsibilities | Deliverables | Tools & Skills |
|---|---|---|---|
| Data Analyst | Data analysis · Visualization · Decision-support reporting | Dashboard · Reports · Insights | SQL · Excel · Power BI / Tableau |
| BI Analyst | KPI tracking · Automated reporting systems · Anomaly detection | KPI Dashboard · Automated strategic reports | Power BI · Tableau · SQL · Qlik |
| Data Scientist | Predictive modeling · In-depth analysis · Hypothesis testing | ML models · Forecasting algorithms · Correlation analysis | Python · R · Scikit-learn · PyTorch · SQL |
| Data Engineer | Building data pipelines · Storage infrastructure management · Ensuring data quality and security | Pipeline · Data Warehouse / Data Lake | Spark · Kafka · Airflow · Docker · Cloud |
| ML Engineer | Deploying models to production · Building CI/CD for ML · Monitoring and optimizing performance | Model API · MLOps pipeline · Stable AI services | Docker · Kubernetes · Cloud · MLOps |
5. Where should you start?
After reading this far, your question should be: "So which direction should I go?" Here's a quick suggestion based on personality and interests:
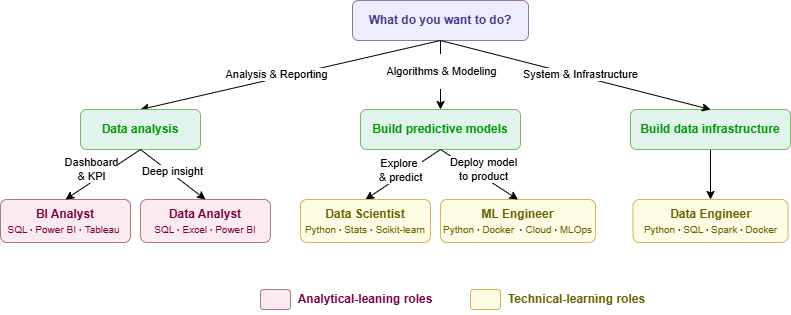
| If you... | Best fit | Start with |
|---|---|---|
| Enjoy analysis, storytelling, and reporting | → Data Analyst / BI Analyst | SQL + Excel + Power BI |
| Enjoy math, algorithms, and building models | → Data Scientist | Python + Statistics + Scikit-learn |
| Enjoy deploying models into real products | → ML Engineer | Python + Docker + Cloud + MLOps |
| Enjoy systems, backend, and infrastructure | → Data Engineer | Python + SQL + Spark + Docker |
| Not sure yet — just starting to explore | → Start with DA | SQL is the first skill to learn |
Practical advice:
No matter which direction you choose, SQL and basic Python are two non-negotiable foundational skills. Start here before worrying about anything else.
Wrapping Up
Data Science is not a single path. It's an ecosystem with many roles, many directions, and many ways to create value from data.
This article is the big-picture overview, but it's only the starting point. Once you've identified the direction you want to go, the next step is to go deeper into each role, each tool, and each specific step in the learning roadmap.
Chưa có bình luận nào. Hãy là người đầu tiên!