
1. Introduction
E-commerce is often seen as a "cash-burning" war to acquire new users (Acquisition), but true profitability lies in keeping them (Retention). In Brazil, Olist is a marketplace giant connecting thousands of retailers with customers across the country. However, behind the impressive revenue growth figures from 2016 to 2018, the system was "bleeding."

The terrifying disparity
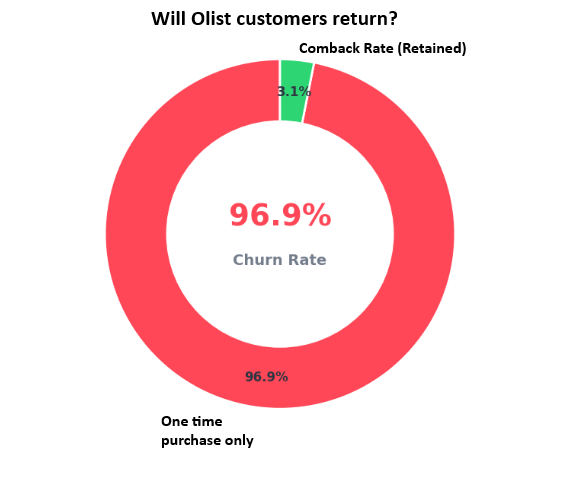
Take a look at this alarming statistic: Over 96% of Olist customers purchase only once and then disappear forever. What causes such an extreme Churn Rate? Is it a lack of recurring shopping needs, or was their experience ruined from the very first touchpoint?
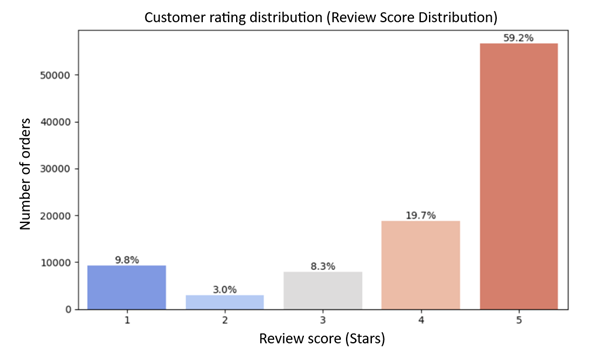
When analyzing the Review Score Distribution of over 100,000 reviews, an interesting truth emerges. This isn't your typical bell curve. While the vast majority of customers are genuinely satisfied (5-star ratings account for over 50%), the 1-star "tail" is abnormally large, making up about 11-12% of total orders.
To put it vividly: For every 10 orders delivered, at least one customer experiences extreme frustration. In the e-commerce industry, a 1-star experience rarely ends with just a complaint-it is often the "death sentence" for a customer's lifecycle. So, what exactly went wrong within those 1-star orders? In this blog post, we will dive deep into every aspect of an order to uncover the truth behind this massive disappearance.
2. Dataset Overview
In this blog, we use the "Brazilian E-Commerce Public Dataset by Olist" available on Kaggle: https://www.kaggle.com/datasets/olistbr/brazilian-ecommerce
This dataset captures the complete shopping journey on the Olist platform from 2016 to 2018 - from the moment a customer places an order to when they receive it and leave a review.
2.1. Data Structure
The dataset consists of 9 main tables, each reflecting a different stage of the shopping journey:
- olist_orders_dataset.csv - 99,441 orders, 8 columns, including order status (order_status) and 5 timestamps from order placement to delivery
- olist_order_items_dataset.csv - 112,650 rows, each representing one product in an order, including price and freight_value
- olist_customers_dataset.csv - 99,441 customers, with geographic information by zip code, city, and state
- olist_sellers_dataset.csv - 3,095 sellers, with similar geographic information as customers
- olist_order_payments_dataset.csv - 103,886 rows, including payment_value, payment method, and number of installments
- olist_order_reviews_dataset.csv - 99,224 reviews, including review_score (1-5 stars) and customer comments
- olist_products_dataset.csv - 32,951 products, including category and physical specifications
- olist_geolocation_dataset.csv - 1,000,163 rows of lat/lng coordinates by zip code
- product_category_name_translation.csv - translation table for 73 product categories from Portuguese to English
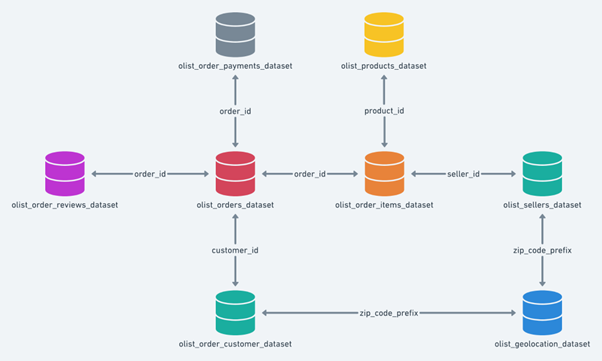
The orders table serves as the central hub, connecting most other tables via order_id and customer_id.
2.2. Analytical Perspective
An order can be viewed as a pipeline:
Order → Processing → Shipping → Delivery → Review
Each step leaves a trace in the data: processing time, shipping duration, cost - and ultimately, review score. This is the foundation for answering the core question of this blog: what actually happens inside a bad order?
3. Data Cleaning
Before any analysis, we need to ensure the data accurately reflects reality. The cleaning process consists of 4 steps: missing values, duplicates, outliers, and logic/format validation.
3.1. Missing Value Check
missing = df.isnull().sum()
missing_pct = missing / len(df) * 100
Missing data was found in 3 main tables:
olist_orders_dataset.csv
print("=== MISSING VALUES: orders ===")
print(orders_raw.isnull().sum())
print(f"Total rows: {len(orders_raw)}")
- order_approved_at: 160 missing rows (0.16%)
- order_delivered_carrier_date: 1,783 missing rows (1.79%)
- order_delivered_customer_date: 2,965 missing rows (2.98%)
These are incomplete orders - not yet approved or not yet delivered. Since all rates are below 5% and the reason is clear, the fix is simple: keep only orders with order_status = "delivered" to ensure consistency across all analyses.
olist_order_reviews_dataset.csv
print("=== MISSING VALUES: reviews ===")
print(reviews_raw.isnull().sum())
print(f"Total rows: {len(reviews_raw)}")
- review_comment_title: 87,656 missing rows (88.3%)
- review_comment_message: 58,247 missing rows (58.7%)
This is not a data error - it reflects user behavior. Most Brazilian customers simply give a star rating without leaving a comment. Actions taken:
- Drop review_comment_title entirely (88% missing, no analytical value)
- Keep review_comment_message and create a has_comment flag so downstream NLP analysis only operates on the ~41% of orders with written content
olist_products_dataset.csv
print("=== MISSING VALUES: products ===")
print(products_raw.isnull().sum())
- product_category_name: 610 products missing (1.85%) → mapped from translation table, remaining labeled "unknown"
- Physical specs (weight, dimensions): 2 rows missing (0.01%) → dropped directly
3.2. Duplicate Check
print("=== DUPLICATES ===")
for name, df in dfs.items():
    n = df.duplicated().sum()
print(f"{name}: {n} duplicate rows ({n/len(df)*100:.2f}%)")
Most tables are completely clean. However, 2 cases require business-logic handling:
olist_order_reviews_dataset.csv
n_dup = reviews_raw.duplicated(subset="order_id").sum()
print(f"Duplicated order_id: {n_dup}")
# output: 551
551 orders have more than one review - this occurs when customers update their rating multiple times. Keep the most recent review by review_answer_timestamp:
reviews_clean = (reviews_raw.sort_values("review_answer_timestamp", ascending=False).drop_duplicates(subset="order_id", keep="first").reset_index(drop=True))
olist_geolocation_dataset.csv
n_zip = geo_raw["geolocation_zip_code_prefix"].nunique()
print(f"{len(geo_raw):,} rows for {n_zip:,} zip codes")
# output: 1,000,163 rows for 19,015 zip codes (avg 52.6 rows/zip)
This is expected - each zip code contains many different addresses. We aggregate to median lat/lng to retain one representative coordinate per zip, preventing row duplication when joining:
geo_clean = (geo_raw.groupby("geolocation_zip_code_prefix").agg(lat=("geolocation_lat", "median"), lng=("geolocation_lng", "median")).reset_index())
3.3. Outlier Check
for col in numeric_cols:
    Q1 = df[col].quantile(0.25)
    Q3 = df[col].quantile(0.75)
    IQR = Q3 - Q1
    lower, upper = Q1 - 1.5 * IQR, Q3 + 1.5 * IQR
    n_out = ((df[col] < lower) | (df[col] > upper)).sum()
    print(f"{col}: {n_out} outliers ({n_out/len(df)*100:.1f}%)")
| Column | Outliers | Rate |
|---|---|---|
| price | 8,427 | 7.48% |
| freight_value | 12,134 | 10.77% |
| payment_value | 7,981 | 7.68% |
| payment_installments | 6,313 | 6.08% |
In an ecommerce context, high prices or large freight values are not data entry errors - they reflect real market conditions. All outliers are retained.
3.4. Logic & Format Validation
# 5 datetime columns are stored as object -- all time calculations
# will be incorrect without parsing
print("=== DATA TYPES: orders ===")
print(orders_raw[DATETIME_COLS].dtypes)
# review_score must be within [1, 5]
invalid_score = reviews_raw[reviews_raw["review_score"].between(1, 5)]
print(f"review_score out of [1,5]: {len(invalid_score)} rows")
# Price and freight cannot be negative
print(f"price < 0: {(items_raw['price'] < 0).sum()} rows")
print(f"freight_value < 0: {(items_raw['freight_value'] < 0).sum()} rows")
# Estimated delivery date cannot be earlier than purchase date
n_illogical = (orders_tmp["order_estimated_delivery_date"] < orders_tmp["order_purchase_timestamp"]).sum()
print(f"Date logic violations: {n_illogical} rows")
Results:
- 5 datetime columns stored as object type → convert all using pd.to_datetime()
- review_score outside [1,5]: 0 rows
- Negative prices: 0 rows
- Date logic violations: 0 rows
- payment_type contains "not_defined" in 3 rows → replaced with NaN
The dataset has very strong logical integrity - no significant violations beyond the data type issue.
3.5. Post-Cleaning Summary
| Table | Before | After | Note |
|---|---|---|---|
| orders | 99,441 | 96,478 | Delivered orders only |
| reviews | 99,224 | 98,673 | Removed 551 duplicate reviews |
| geolocation | 1,000,163 | 19,015 | One representative coordinate per zip code |
| products | 32,951 | 32,949 | Dropped 2 rows missing weight/dimensions |
Two new columns were also created for downstream analysis:
- delivery_delay_days = actual delivery date − estimated delivery date (positive = late, negative = early)
- has_comment = True if the order has written review content
After this step, 6,535 orders (6.6%) were identified as late deliveries. A seemingly small number - but its impact on customer experience is far greater than the percentage suggests. The following sections will demonstrate exactly that.
4. The Market Through a Time-Series Lens
4.1. Growth Overview
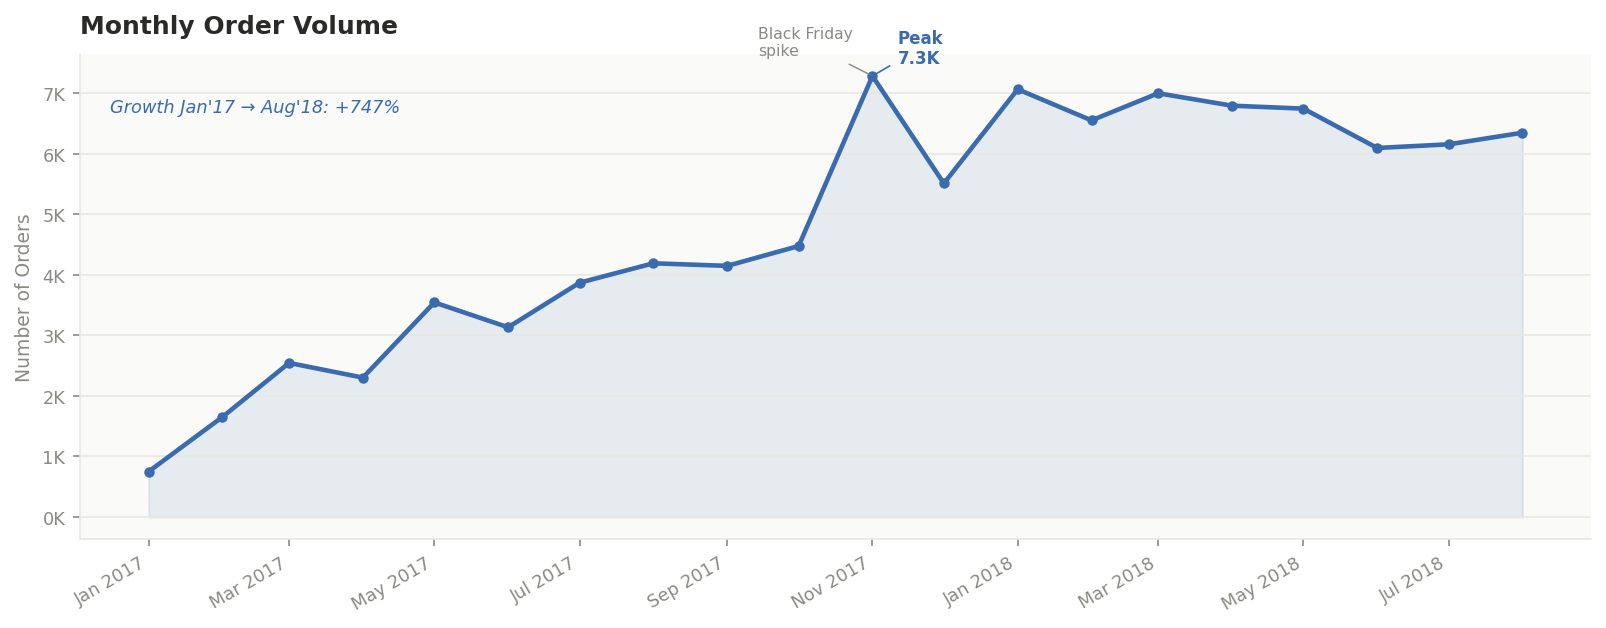
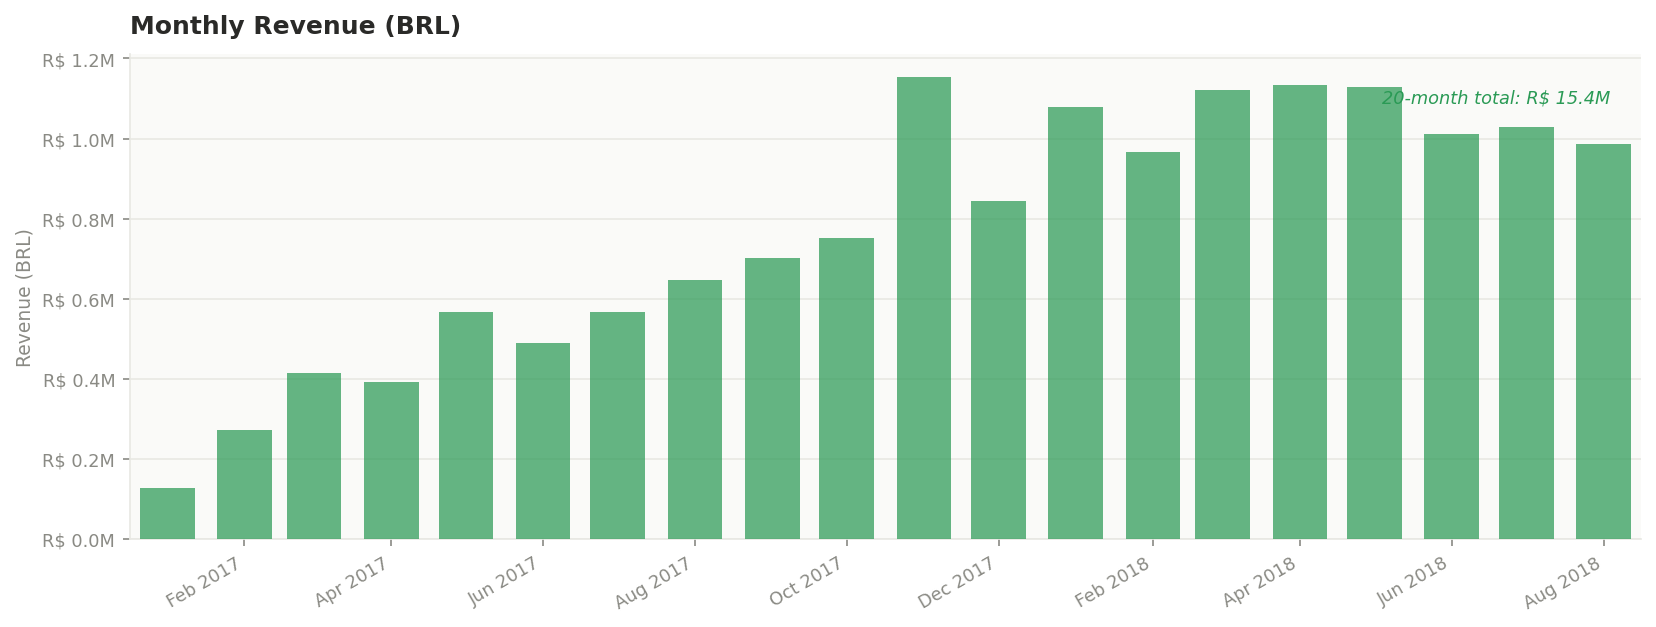
Over the 20-month period from January 2017 to August 2018:
- Monthly order volume grew from 750 to 7,300 orders (+747%)
- Total revenue reached $ 15.4 million
These numbers place Olist among the fastest-growing marketplaces in the region - within just two years of operation. But this is only the surface of a larger story.
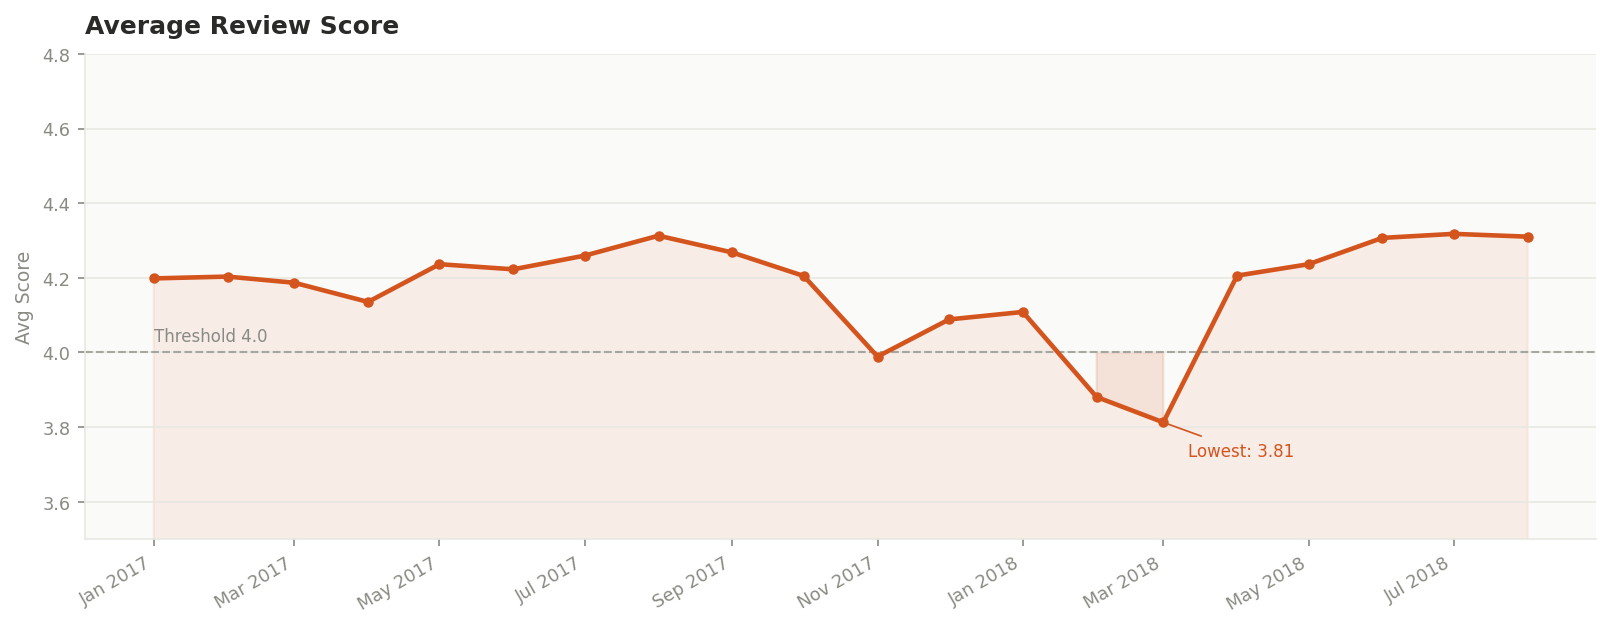
4.2. The Review Score Paradox
Throughout 2017, the average review score held steady around ~4.2. Then in March 2018, it dropped to 3.81 - the lowest point in the entire dataset.
A question emerges: why did customer experience hit its worst point exactly when the platform was growing the fastest?
4.3. Unstable Growth
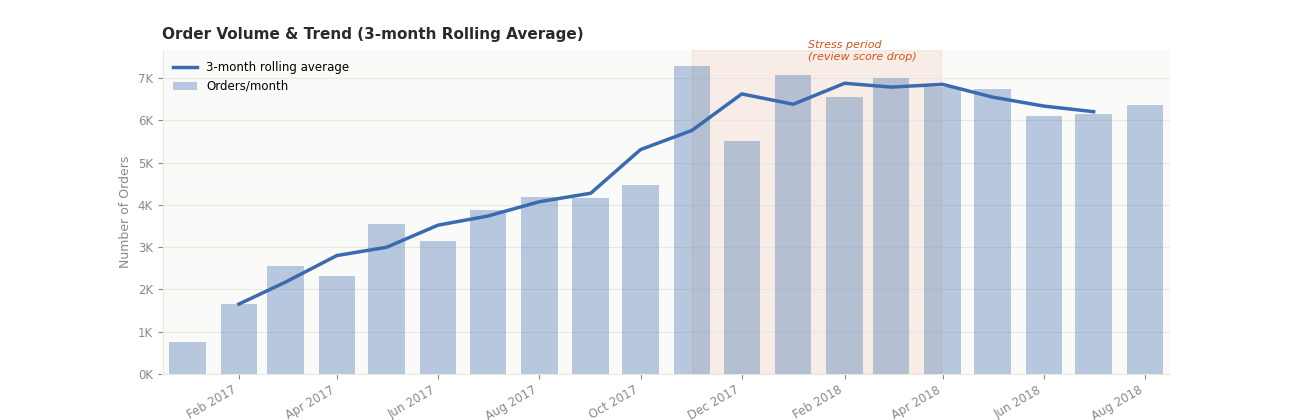
Breaking down growth into two layers starts to reveal the answer:
- Rolling Average (3-month): removes short-term noise, revealing a steady and sustained upward trend - averaging +15.9% per month
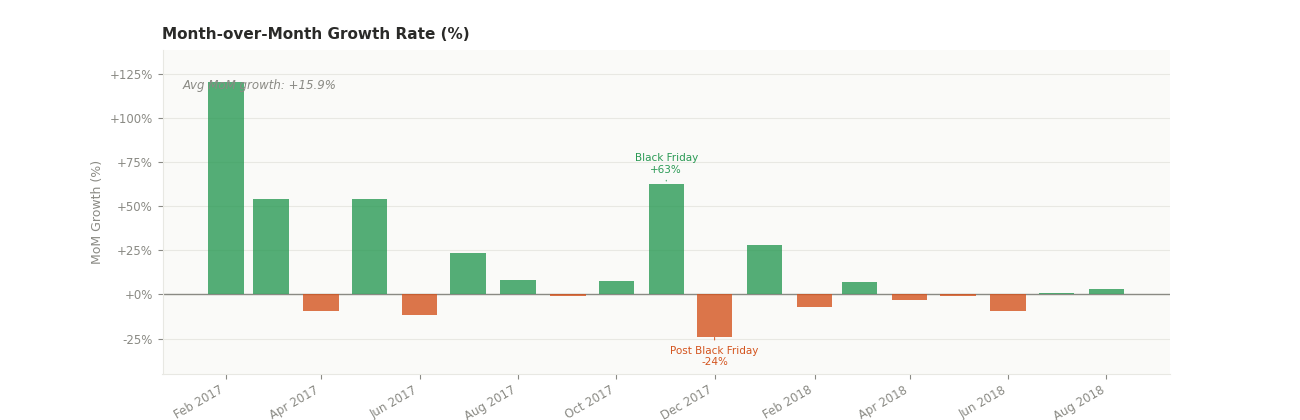
- Month-over-Month (MoM) Growth: actual growth was uneven with sudden shocks:
- Black Friday, November 2017: volume spiked +63% in a single month
- December 2017: dropped -24% immediately after
4.4. The System's Stress Period
From November 2017 to March 2018 (highlighted in red on the chart):
- Order volume surged and remained abnormally high
- Review score declined sharply, bottoming out 4 months later
This period can be described as the system's "stress period". Notably, review scores did not drop immediately when volume spiked - there was a lag of several months. This suggests the problem was not demand itself, but the system's ability to absorb and adapt to that demand over time.
Insight: Olist did not just grow fast - they grew unevenly, creating shocks that the logistics infrastructure was not prepared to absorb. The low-rated orders analyzed throughout this blog are not random occurrences - they are the direct consequence of this unstable growth pattern.
5. The journey of an order
The goal of this section is to "dissect" the operational stages of an order to identify the bottlenecks. We will compare the processing times of 5-star orders versus 1-star orders.
5.1. Where does the critical point?
We utilized Funnel Analysis to visualize an order's journey-from payment and approval to the moment it reaches the customer-as shown in the chart below:
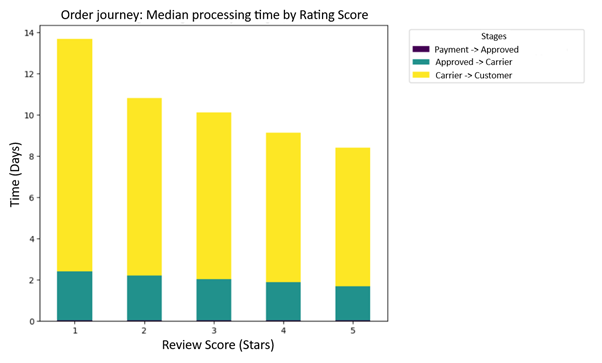
To understand why customers leave indignant 1-star reviews, we need to dismantle Olist's operational process. A successful order must pass through three checkpoints (Funnel):
- Purchase to Approve: The time taken for payment confirmation.
- Approve to Carrier: The time taken by the seller to pack and hand over the goods to the logistics provider (Carrier).
- Carrier to Customer: The journey of the package while in transit to the buyer.
By measuring the median time at each step and segmenting them by review scores, the true culprit begins to emerge.
The difference between a 5-star and a 1-star order does not lie in the payment or packaging stages. The data shows:
- Internal Processing (Payment & Packaging): The time gap between 1-star and 5-star orders is almost negligible. Olist's payment approval system operates smoothly, and sellers generally adhere well to packaging deadlines (usually taking about 1-2 days).
- The Bottleneck: The "Carrier to Customer" stage is the graveyard of customer experience. While 5-star orders typically take about 6-7 days for transit, 1-star reviewers are left waiting for an average of over 13-14 days. The longer the wait, the further the score slides.
This gap is even more evident when cross-referenced with the is_late variable (Late delivery compared to the estimate). The late delivery rate for the 5-star group remains extremely low, but for the 1-star group, this figure skyrockets. This breakdown in logistics, compounded by Brazil's vast geography, has turned last-mile delivery into the biggest loophole driving customers away forever.
5.2. The "Black Hole" of Frustration: When Promises Are Broken
Furthermore, customer anger stems from the disconnect between expectations and operational reality. Take a look at the chart below to see how the "delivery promise" was shattered.
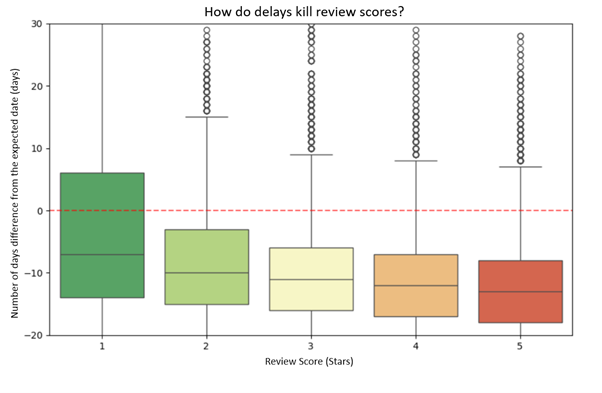
Based on the Delivery Delay Analysis (the difference between actual delivery date and the estimate), a harsh pattern emerges:
- The Euphoria of the 5-Star Group: Orders that receive 5 stars often have a negative delay (meaning the goods arrived earlier than expected). Customers don't just want punctuality; they love the feeling of having their "expectations exceeded."
- The Indignation of the 1-Star Group: Looking at the Boxplot, the 1-star group shows "whiskers" stretching as far as 20-30 days late. These are cases of severe "broken promises." Once an order passes the committed date, every passing day subtracts a point of customer trust.
The life-or-death bottleneck for Olist lies in Last-Mile Logistics (the carriers). Customers aren't leaving because of poor products; they are leaving because Olist broke its commitment to time. To rescue their Retention Rate, Olist cannot simply improve its software; they need a physical infrastructure strategy-bringing goods closer to the customer through a smart warehousing system in key states.
6. What Truly Drives Review Scores?
6.1. Correlation Heatmap
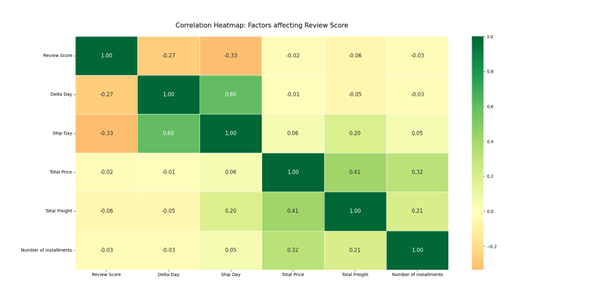
Delta Day: The difference between the actual delivery date and the estimated delivery date (Delivered Date - Estimated Date).
Ship Day: The total number of days taken for delivery (transition time).
Total Price: The total monetary value of the order.
Total Freight: The total shipping and handling cost.
Number of Installments: The number of monthly payment periods (deferred payment plan).
Correlation between Review Score and Logistics Variables
- Ship Day (-0.33): This variable exhibits the strongest negative correlation with Review Score. As the actual delivery time increases, the score decreases. Customers base their ratings heavily on the physical "waiting experience."
- Delta Day (-0.27): This coefficient reveals that "broken promises" (delivering after the estimated date) have a clear negative impact on scores. However, since this is lower than Ship Day, it suggests that customers are inherently frustrated by long wait times, even if they were forewarned by a distant estimated date.
The Interplay between Operational Variables: Delta Day & Ship Day (0.60)
- Strong Positive Correlation: This is intuitive-the longer the transit journey, the higher the probability of encountering en-route incidents, leading to a breach of the promised delivery date.
- Contextual Insight: Since the correlation is not 1.0, it proves that Olist's estimation system attempts to compensate for long distances by padding the guaranteed delivery window.
The Logic of Cash Flow and Products
- Total Price & Number of Installments (0.32): Positive correlation. Customers tend to opt for longer payment terms when purchasing high-ticket items. Installment-based purchasing is a deeply rooted consumer culture in Brazil.
- Total Price & Total Freight (0.41): Moderate correlation. High-value goods (e.g., appliances, electronics) are often bulkier or heavier, leading to higher shipping costs. Alternatively, high-end electronics (laptops, smartphones) may require higher shipping insurance premiums.
Relationship between Product Value and Shipping Costs (0.41)
- Premium Goods vs. High Freight: Expensive items often come with higher shipping fees due to their physical dimensions or the need for specialized packaging and insurance.
- Optimization Opportunity: A correlation of 0.41 is only moderate. This suggests a segment of "low cost but high freight" items, likely driven by extreme geographical distances (e.g., shipping from São Paulo to remote peripheral states).
The Synergy between Ship Day and Total Freight (0.20)
- The "Distance Penalty": Higher freight costs usually signal greater geographical distances. Greater distance naturally leads to a longer actual delivery time (Ship Day).
- Key Insight: Customers in remote areas face a "double penalty": paying more for shipping while waiting longer. This specific segment is the most vulnerable to low Review Scores, as visualized on the geographical risk map.
The data confirms a paradox in consumer psychology: Customers are relatively more accepting of high Total Prices or expensive Freight, but they are exceptionally unforgiving regarding long Ship Days and, most critically, "broken promises" (Delta Day) during the fulfillment journey.
6.2. Density and LOESS Analysis: The Impact of Delivery Performance on Review Scores
Ship Day (Actual Delivery Time)
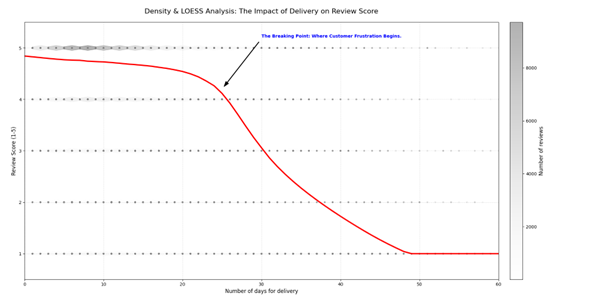
- Safe Zone (0 - 20 Days): Within this range, the red LOESS curve exhibits a very shallow decline. Customers remain relatively satisfied and are still willing to provide 4 to 5-star ratings, even if the delivery time increases by a few days.
- The "Breaking Point" (~25 Days): This is a critical data insight. As soon as the delivery time surpasses the 25-day mark, the LOESS curve plunges sharply. This indicates that customer patience has completely exhausted, leading to a surge in 1 and 2-star reviews.
- The Despair Zone (> 50 Days): Beyond 50 days, the average score hits rock bottom (1 star). At this stage, any marginal improvement in speed is meaningless, as the customer is already entirely disillusioned.
Delta Day (The Gap between Estimated and Actual Delivery)
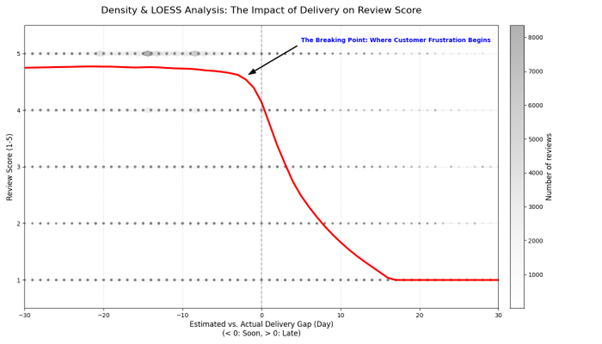
The "Exceeding Expectations" Zone (Delta Day < 0): When the order arrives earlier than expected (the area to the left of the zero mark), the average score remains remarkably stable, close to 5 stars. You can observe that the red LOESS curve is almost horizontal, proving that customers are highly satisfied with early deliveries
The Transition Zone (0 to 5 Days Late): A decline in scores begins to emerge here, but it is not yet severe. At this stage, customers still maintain a certain level of patience
The "Breaking Point" (5 Days): Immediately after crossing the 5-day delay threshold, the LOESS curve begins to plunge sharply. This is the exact moment when patience transforms into total frustration
6.3. Conclusion
By synthesizing Actual Delivery Time and Deviation from Estimates, we can derive a strategic conclusion for your analysis. These two charts do more than just describe data; they define the "Rule of Trust" in e-commerce:
The Synergy between "Time" and "Promises"
- Actual Delivery Time: Data shows that customer patience begins to deplete after 25 days of absolute waiting.
- Delivery Deviation: Supplemental data reveals that frustration explodes after just 5 days if the delivery exceeds the initial estimate.
- Conclusion: You can afford a longer delivery window (e.g., 20 days), but you must not exceed your promised date by more than 5 days. Customers prefer a "20-day promise" delivered on time over a "10-day promise" that arrives in 15 days.
Defining the "Free-Fall Zone" of Trust
Both charts confirm a non-linear phenomenon (satisfaction does not decrease incrementally day-by-day; it collapses):
- The Stability Zone: Between -30 to 0 days of deviation and 0 to 20 days of total transit time, customer loyalty remains "impenetrable," with scores consistently near 5 stars.
- The Collapse Zone: The moment the data crosses the "Breaking Point," scores do not merely dip-they plummet. This indicates that customer tolerance vanishes instantly once waiting exceeds a psychological threshold.
In logistics, speed is an advantage, but accuracy against commitment is the "airbag" that protects your brand. Customers may tolerate a long journey, but their patience will utterly collapse if you cross the threshold of a 5-day delay or a 25-day total wait.
7. What do customers complain about?
7.1. When data reveals the real "pain"
If the previous section showed that review scores are the final outcome, here we go deeper into the emotional causes behind 1-star reviews. To do that, instead of reading reviews subjectively, I used NLP combined with topic modeling to extract the most common themes in customer feedback.
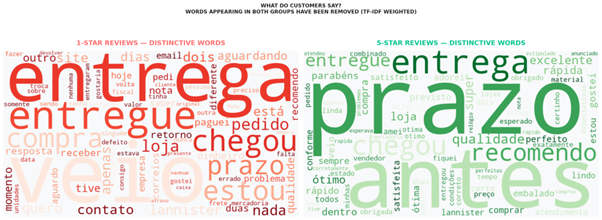
When looking at the word cloud, the difference between the two groups becomes immediately clear. In the 1-star group, the most prominent words revolve around signals of frustration: entrega (delivery), prazo (deadline), chegou (arrived), atraso (delay), reclamação (complaint), aguardando (waiting), problema (problem). These words do not just describe a late order, but a prolonged experience of waiting, frustration, and loss of trust.
In contrast, the 5-star group shows a completely different language. Words like prazo, entrega, rápida (fast), ótimo (great), perfeito (perfect), recomendo (recommend), qualidade (quality) appear frequently. This shows that customers are not only satisfied because they received the product, but because it arrived on time - or even exceeded expectations. In other words, positive reviews are not driven by the product alone, but by a smooth delivery experience.
7.2. Topic modeling: complaints are structured, not random
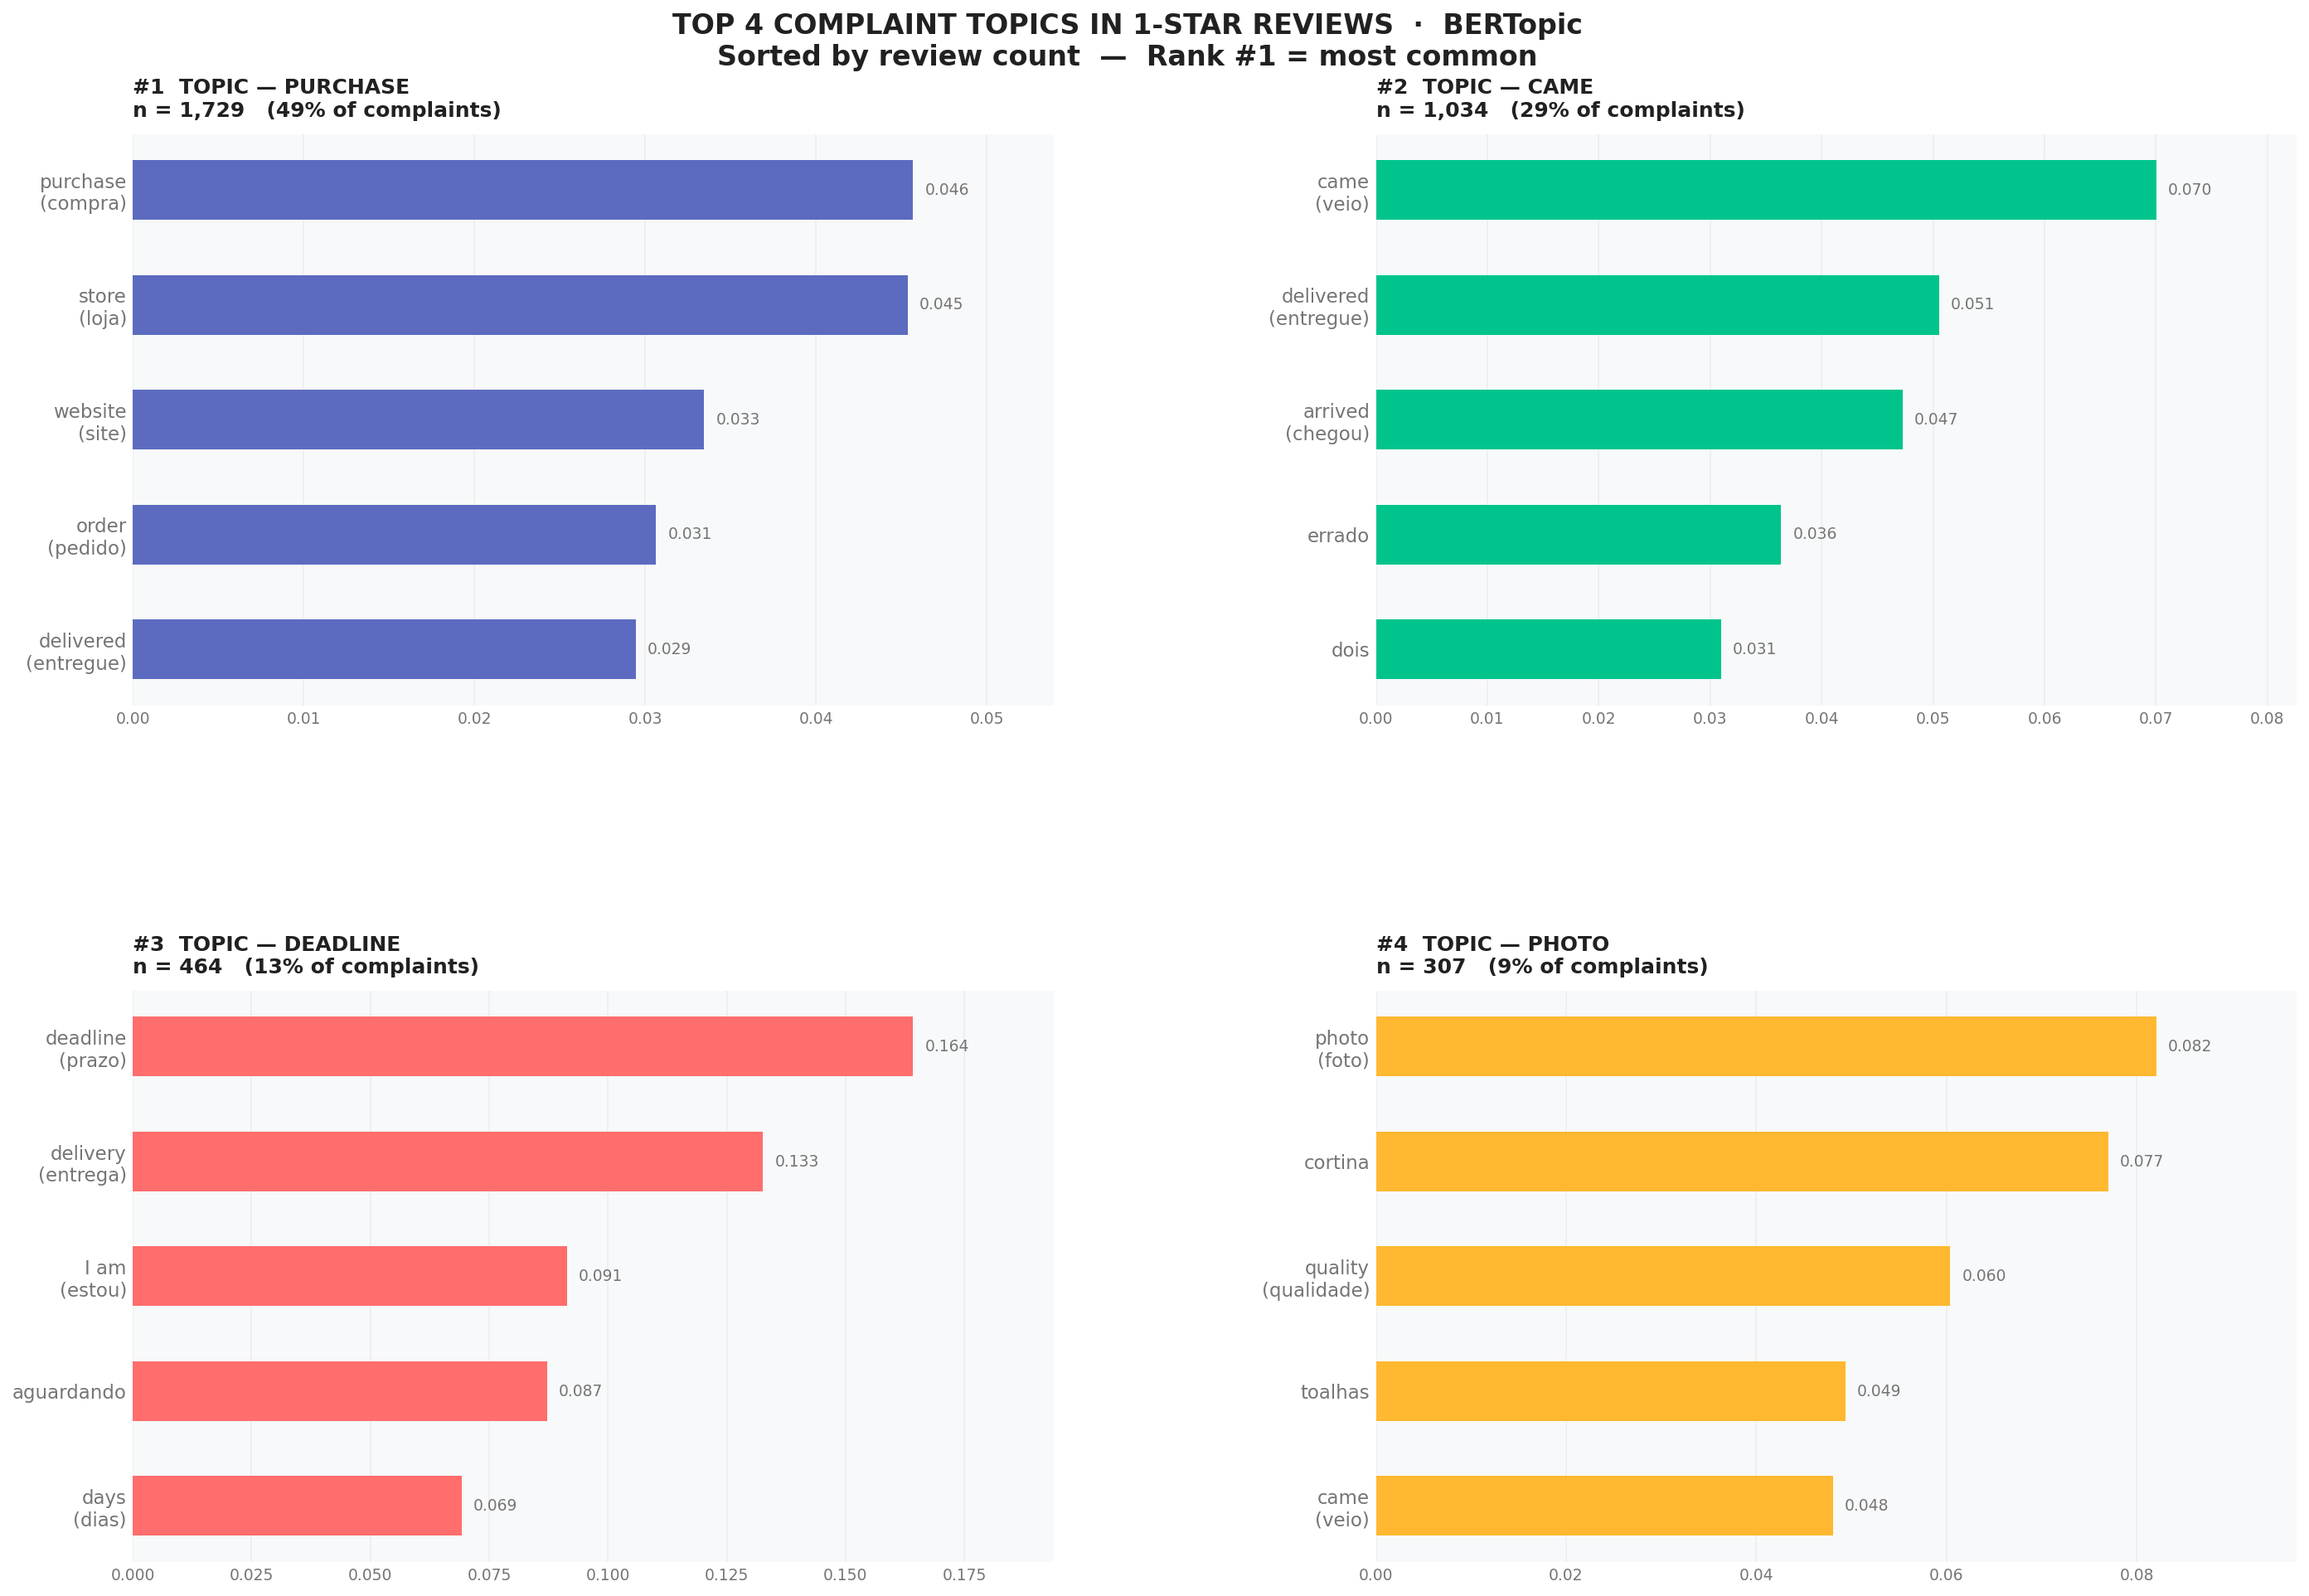
When going deeper with BERTopic, complaints in the 1-star group are not random. They cluster into clear topics. The largest topic is Delivery, dominating almost all 1-star reviews. Within this topic, keywords such as delivery, came, delivered, arrived, still show a common pattern: customers repeatedly mention whether the order has arrived, how late it is, and why it is still unresolved.
Smaller topics like relógio (watch), cadeira (chair), cortina (curtain) do not indicate that these products are the core issue. Instead, they show that complaints are tied to specific orders, while the root cause of dissatisfaction lies in the delivery process rather than the product category itself. This is very important: customers do not leave 1-star reviews because they bought a watch or a chair, but because their order was pulled into a poor operational experience.
From an analytical perspective, this leads to a key conclusion: low reviews are not randomly distributed across products; they are heavily concentrated in logistics. In other words, Olist is not failing at what it sells, but at what happens after the purchase. And when customers start using language related to waiting, delays, and broken promises, it signals that trust is already breaking.
8. After a bad experience - do customers come back?
8.1. Retention is not just about keeping customers, but keeping trust
After understanding what customers complain about, the next question is: does a bad experience really drive customers away permanently?
This is where survival analysis becomes useful. Instead of asking "who churns?", we ask: how long does it take before customers stop coming back? And does this differ across experience groups?
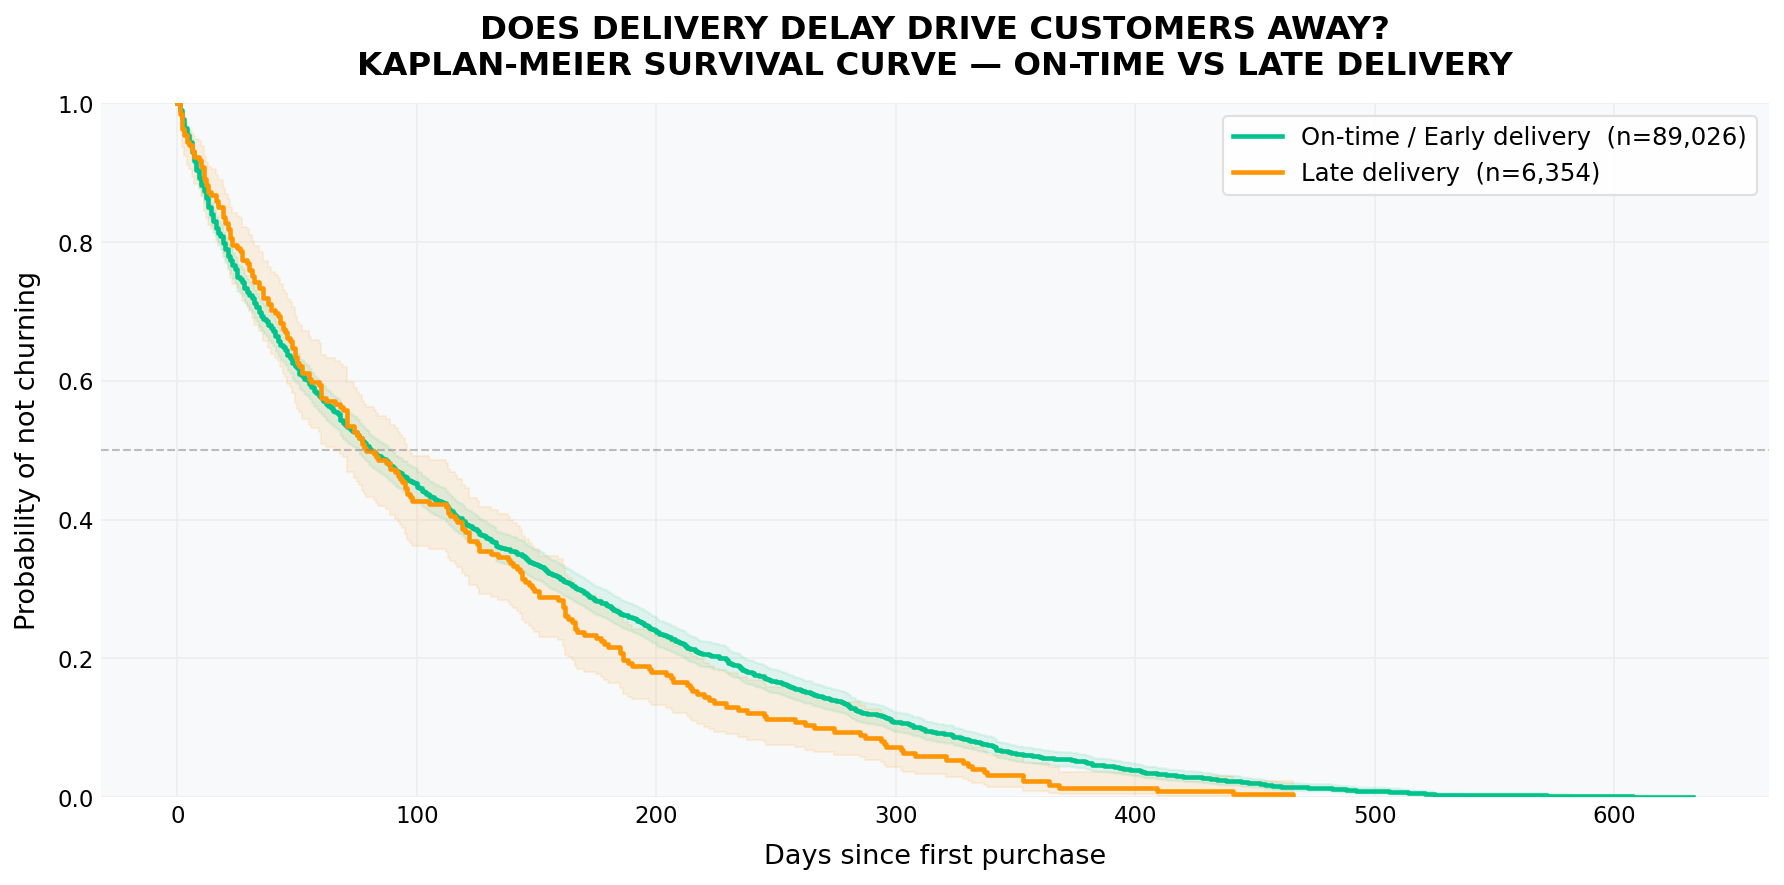
The Kaplan-Meier curve shows a clear pattern: the late delivery group stays below the on-time/early group almost throughout the entire timeline. This means that right after the first purchase, customers who experienced delays already have a lower probability of returning. The gap does not explode immediately, but it appears early and persists over time. This is a dangerous type of churn in e-commerce: customers do not leave immediately, but gradually disengage faster.
Notably, the survival curve for delayed deliveries is consistently lower in the early stage of the timeline - the period when customers are still deciding whether to purchase again. This shows that delivery delays do not just create temporary frustration; they reduce the likelihood of repeat purchases at the most critical retention moment.
8.2. A bad experience shortens customer lifetime
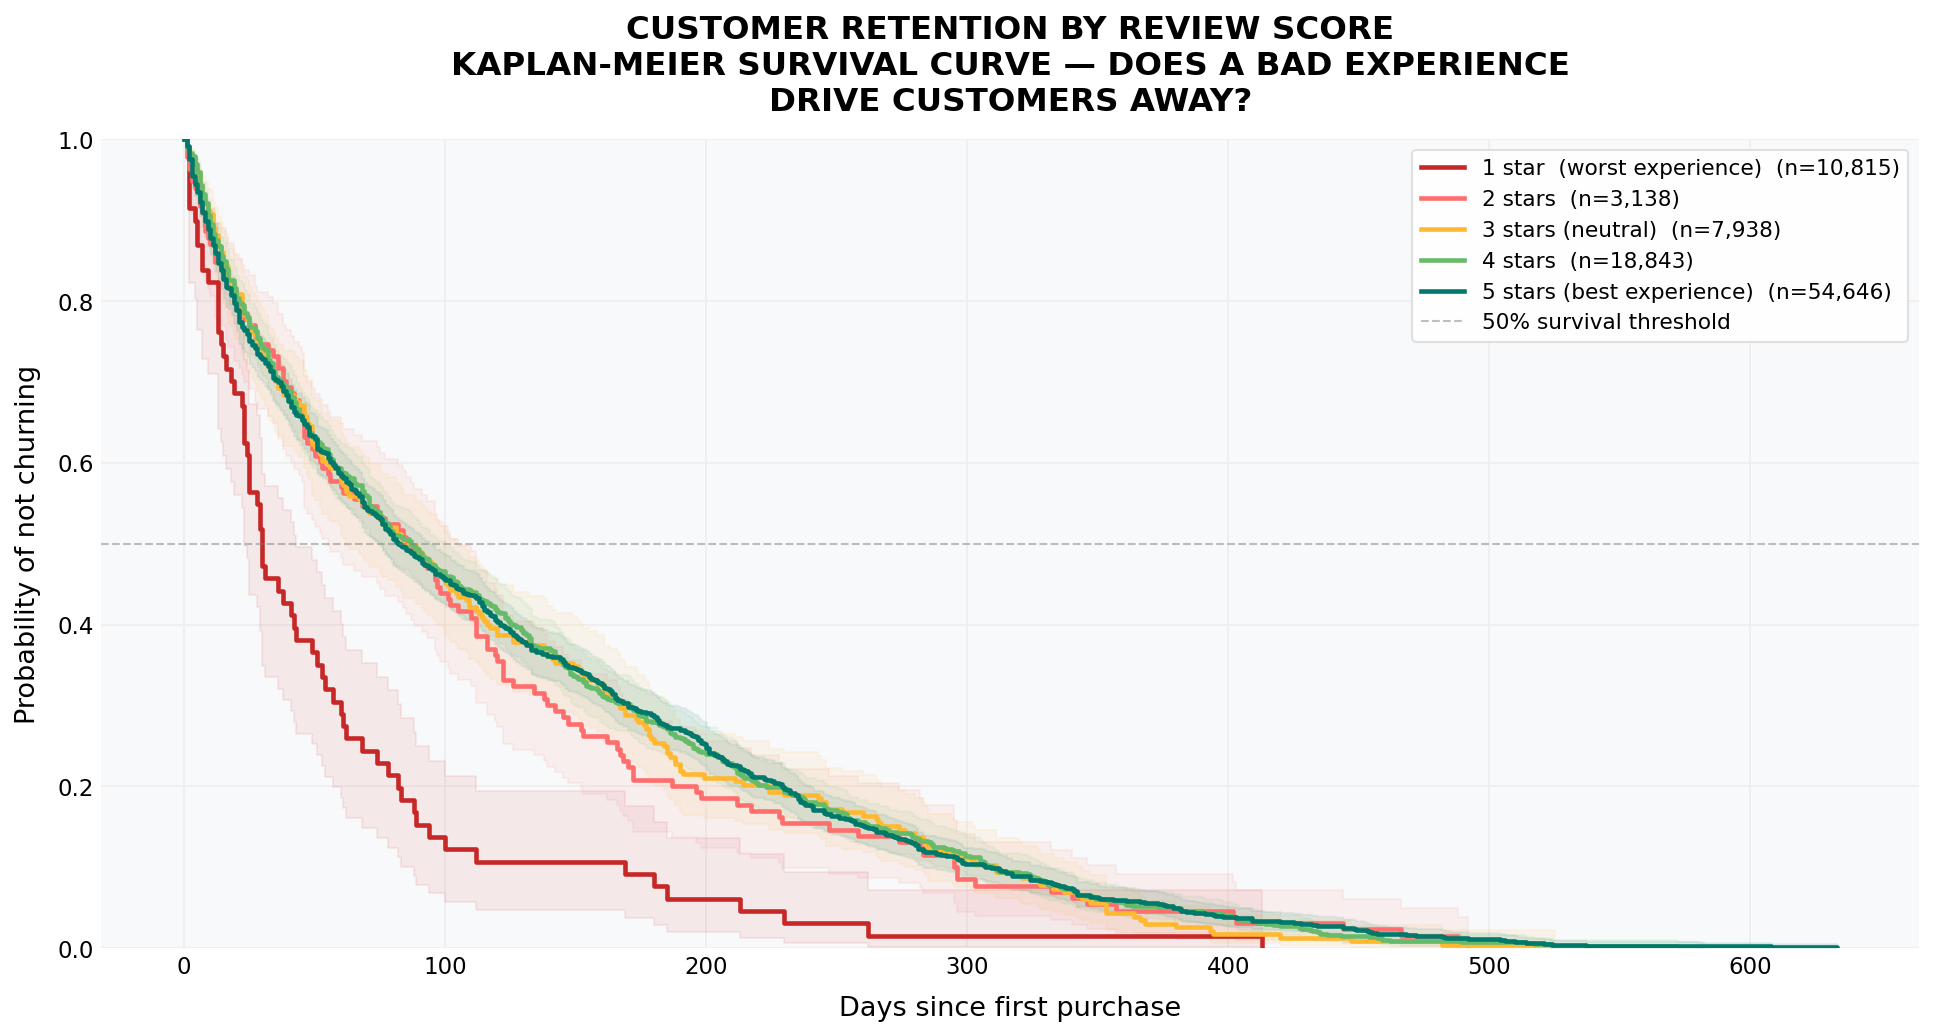
Looking at the survival curve by review score, the pattern becomes even clearer. The 1-star group drops very quickly and separates from the other groups almost immediately. The 2-5 star groups follow more similar trajectories, but still show a consistent trend: the higher the rating, the longer customers stay.
Importantly, the 1-star group is not only lower, but declines much faster. In retention terms, this group has the shortest customer lifetime. A very bad experience does not just cost one order, but eliminates the future value of that customer. From a business perspective, this loss is much larger than a single late delivery: Olist loses not only current revenue, but also the ability to turn customers into repeat buyers.
8.3. Conclusion
Combining both analyses, we see a consistent pattern: delivery delay creates frustration; low reviews capture that frustration; and survival analysis shows that it turns into future churn.
In other words, a bad experience does not just ruin one order - it breaks the relationship between the customer and the platform. For Olist, the problem is not whether customers buy, but whether they have enough reason to come back after a bad experience.
The data shows clearly: the worse the experience, the faster customers leave; the more broken the promise, the shorter the customer lifetime.
9. Geographical Distribution of Delivery Efficiency
9.1. Logistics Risk Map
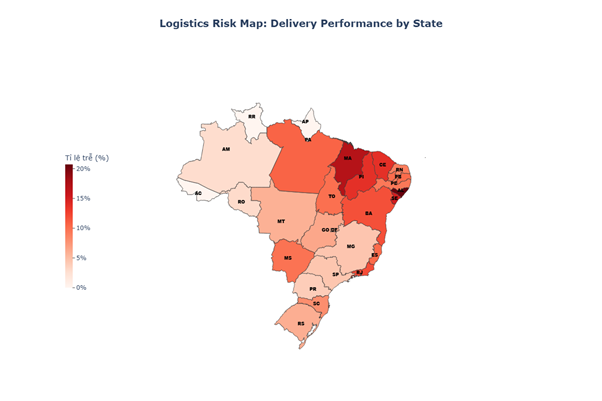
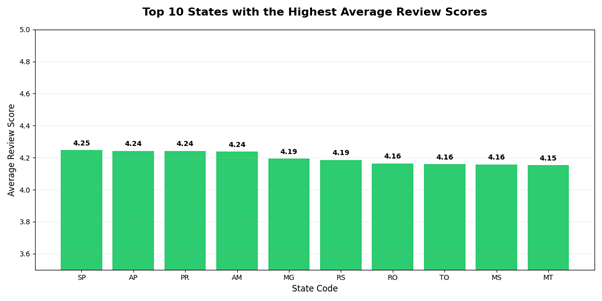
By cross-referencing the Logistics Risk Map with the Top 10 States by Average Review Score, we identify three standout cases: MS, TO, and RS. Despite having high late rates (>5%), these states maintain customer satisfaction levels within the top tier.
While late rates are typically inversely correlated with review scores, the presence of MS (9.76%), TO (10%), and RS (5.99%) among the highest-rated states suggests that other management factors are compensating for these delays:
- Mato Grosso do Sul (MS - 9.76%) & Tocantins (TO - 10.0%): Despite their high late rates (indicated by dark orange on the map), both states achieved an impressive review score of 4.16. This suggests that customers in these regions may have more realistic delivery expectations due to their geographical location or that Olist has excelled in status updates and communication, thereby mitigating the frustration of delayed shipments.
- Rio Grande do Sul (RS - 5.99%): With a late rate of approximately 6%, RS still secured a high score of 4.19. This serves as a testament to superior product quality or customer service in the Southern region, which proves strong enough to persuade customers to "forgive" minor logistical errors.
The contrast becomes stark when looking at states like MA (Maranhão) and PI (Piauí) on the map:
- These states have late rates exceeding the critical risk threshold (>15%, indicated in dark red).
- Consequently, they are entirely absent from the Top 10 Review Score list.
- Observation: The 10% threshold (seen in MS and TO) appears to be the "final limit" of consumer tolerance. Once the late rate surpasses this point and enters the 15-20% range, customer satisfaction collapses, making it impossible to remain among the top performers.
In contrast to the groups above, states like SP (São Paulo) and PR (Paraná) demonstrate absolute stability:
- Extremely low late rates (the lightest colors on the map, typically <5%).
- Leading the review rankings with scores ranging from 4.24 to 4.25.
These states represent the Benchmark that others should strive for: where operational speed goes hand-in-hand with maximum customer satisfaction.
9.2. Geographical Correlation between Sellers and Customers
To analyze this metric, we categorize the orders into three distinct groups:
- Intrastate: Orders where the product originates from the same state as the customer.
- Interstate: Orders where the product originates from a different state than the customer.
- Hybrid Origin: Multi-item orders containing at least one product from the same state and at least one from a different state.
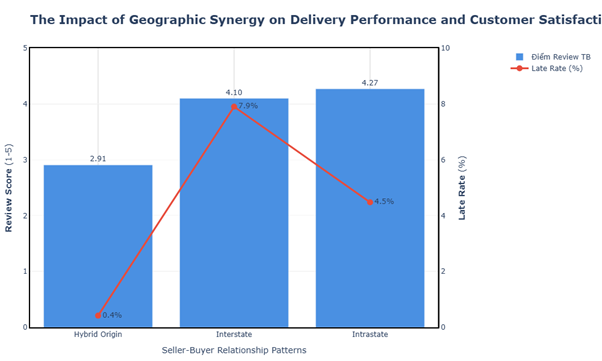
Intrastate Group: The Ideal Benchmark
- Key Metrics: Highest Average Review Score (4.27) and a low Late Rate (4.5%).
- Insight: This is the clearest evidence of the "Proximity Advantage." Short distances minimize supply chain risks, resulting in consistent and high levels of customer satisfaction.
Interstate Group: The Friction of Distance
- Key Metrics: Late Rate surges to a peak of 7.9%, dragging the Review Score down to 4.10.
- Observation: Consistent with logistics models, when goods transit across states, infrastructure hurdles and extended lead times drive up the probability of delays, directly eroding the overall user experience.
Hybrid Origin Group: The Data Paradox
- Key Metrics: A record low Late Rate (0.4%), yet the Review Score hits rock bottom (2.91).
- Analysis: Conventionally, faster delivery correlates with higher scores; however, this group presents a striking anomaly. This suggests several behavioral hypotheses:
- Asymmetrical Expectations: When customers purchase multiple items (some local, some remote), they tend to anchor their expectations to the fastest item. Any deviation in arrival times creates perceived friction, even if the average speed is high.
- Fulfillment Complexity (Split Shipments): Hybrid orders often result in fragmented deliveries. Customers may find receiving multiple packages at different times bothersome, leading to poor ratings regardless of the actual delivery velocity.
10. Conclusion: The Real Battle is Not Growth, It's the Promise
Looking back at the entire analytical journey, Olist's story is no longer a simple growth equation; it is a story of trust.
During the 2017-2018 period, Olist excelled at what every e-commerce platform craves: rapid market expansion. However, that very speed inadvertently created "cracks" in operations particularly in last mile logistics. When these cracks appeared, they didn't just delay a single order; they fractured the entire customer experience.
The data reveals a very clear cause-and-effect chain:
- Unstable growth → Logistics system becomes overloaded.
- Operational overload → Slow deliveries and broken promises (delays).
- Delays → Review scores plummet (especially after the 5-day threshold).
- Low reviews → Customers leave faster (churn spikes).
The ultimate result is the terrifying figure mentioned at the start: over 96% of customers never return.
One of the most critical insights from the entire analysis is: customers may accept a long wait-but they do not accept a broken promise.
- Delivery in 20 days but on time → Can still receive 4-5 stars.
- Promised 10 days but delivered in 15 days → Highly likely to receive 1-2 stars.
This redefines priorities in e-commerce:
- Speed is a competitive advantage.
- However, the accuracy of the promise is the foundation of trust.
The strategic bottleneck: Logistics. Customers are not leaving because of bad products:
- 1-star reviews focus on: delivery, waiting, delays.
- They do not focus on: product quality.
This means:
Olist did not fail at "what they sold," but at "how they delivered."
Customer retention cannot be "bought" with marketing; it must be built through operations.
Strategic directions include:
- Building distributed warehouse systems closer to customers.
- Optimizing last-mile delivery.
- Improving Estimated Time of Arrival (ETA) forecasting systems.
- Real-time transparency of order status.
- Managing customer expectations instead of "over-promising."
E-commerce is often seen as a battle of:
- Price
- Product
- User Interface (UI) experience
But in reality, it is a battle of logistics and trust.
Olist won the battle of bringing customers to the platform for the first time. But they lost the battle of keeping them there.
The data has proven a simple but harsh truth: a poor delivery experience doesn't just lose one order; it erases the entire lifetime value of that customer.
11. Reference
-
Visualization Assets: All images in this article were generated using Python libraries, with the exception of Figure 1 (Olist: Lesson on customer retention and attraction), which was created using Gemini AI.
-
LOESS Regression: A data smoothing technique used to identify underlying trends in complex datasets (Lowess Smoothing).
-
Kaplan-Meier Estimator: A non-parametric method used to estimate the survival function and analyze customer retention over time (Kaplan Meier).
-
Pandas & NumPy: Essential Python libraries for structured data manipulation and high-performance numerical computing (Pandas Doc).
- Matplotlib & Seaborn: Powerful tools for statistical data visualization and aesthetic plotting (Seaborn Doc).
Plotly Express: A high-level library used to create interactive choropleth maps of Brazil based on regional logistics data (Plotly Express).
- This analysis incorporates advanced data science methodologies and practical insights gained from the AIO2026 course.
Chưa có bình luận nào. Hãy là người đầu tiên!