
Welcome to the Essential Machine Learning Blog
Welcome to your journey into the fascinating world of Machine Learning! 👋🤖
About This Blog
We’re living in an era where Machine Learning (ML) is no longer just a sci-fi concept. It’s quietly reshaping our daily lives. From Netflix movie recommendations and virtual assistants like Siri or Google Assistant, to breakthroughs in medical diagnosis and self-driving cars—Machine Learning is everywhere.
But what exactly is Machine Learning? How can a machine "learn" from data without a human explicitly programming every single step? And more importantly, where should you start in this vast ocean of knowledge?
I created this blog to help you answer these questions. Here, I'll share a series of posts ranging from basic to advanced topics, simplified so anyone can get into it. Whether you’re a student, a developer looking to pivot into AI, or just a tech enthusiast, I hope you’ll find valuable takeaways for your journey right here.
Chapter 1: What is Machine Learning?
1.1 Introduction
Machine Learning isn't just a tech buzzword; it’s become the core driver of the 21st-century digital revolution. It fundamentally changes how we solve problems: instead of rigid hard-coding, we teach computers to learn on their own.
From everyday apps like medical diagnosis tools, virtual assistants, and autonomous vehicles, to macro-scale challenges like climate modeling, Machine Learning has become an indispensable tool in modern computer science.
1.2. Definitions and basic concepts
1.2.1 Definition
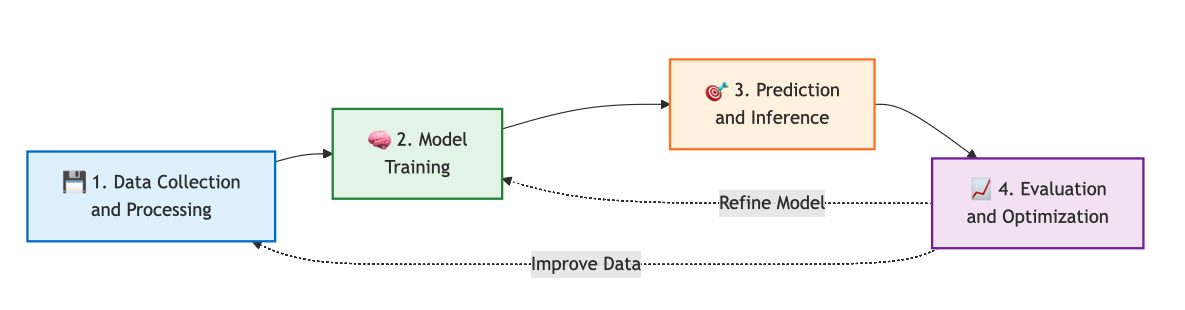
Machine Learning is a branch of Artificial Intelligence (AI) focused on building algorithms and statistical models that enable computers to "learn" from data. Instead of being explicitly programmed for every specific scenario, the system improves its performance through experience.
1.2.2 Formal definition
Mathematically speaking, a Machine Learning problem is formally defined as follows:
"A computer program is said to learn from experience $E$ with respect to some class of tasks $T$ and performance measure $P$, if its performance at tasks in $T$, as measured by $P$, improves with experience $E$."
A Simple example (spam filter):
* Task ($T$): Classifying emails as "Spam" or "Not Spam".
* Experience ($E$): Examining emails previously marked by users.
* Performance ($P$): The percentage of emails correctly classified.
1.2.3 The paradigm shift
The biggest difference between Traditional Programming and Machine Learning lies in the flow of data and rules:
-
Traditional Programming: We have to understand the problem and write the rules (logic) for the computer to process data and produce a result.
$$\text{Data} + \text{Rules (Code)} \rightarrow \text{Result}$$ -
Machine Learning: The computer looks at the data and the desired results, then figures out the rules (model) on its own.
$$\text{Data} + \text{Result (Output)} \rightarrow \text{Rules (Model)}$$
Core Objective:
The goal is to find a function $f: X \to Y$ that maps input $X$ to output $Y$ as accurately as possible. More importantly, this function must be capable of generalization—meaning it works well even on new data it’s never seen before.
Chapter 2: Categorizing Machine Learning Algorithms
2.1 Supervised Learning
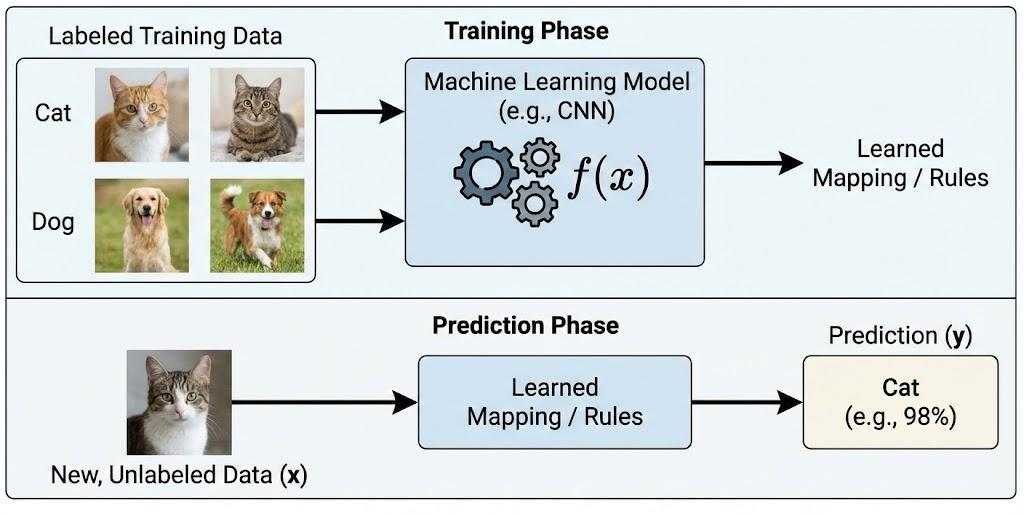
Supervised Learning is an ML method where the model is trained on a labeled dataset. Each data sample consists of an input and a desired output. The model’s goal is to learn the mapping from input to output so it can accurately predict labels for new, unseen data.
Example:
In a dog vs. cat image classification problem, we have training data consisting of thousands of images already labeled as "cat" or "dog". We feed these images into an algorithm and tell it which ones are which. After the algorithm builds a model, when it sees a new image it’s never seen before, it predicts whether it's a dog or a cat.
Applications:
Supervised learning is widely used in prediction and decision-making systems like financial fraud detection, disease diagnosis, image recognition, and natural language processing.
Supervised learning algorithms are usually split into two main types:
2.1.1 Classification
Classification is a supervised learning problem where the output is a discrete label. The goal is to assign each input data sample to one of the pre-defined categories.
Examples:
Gmail deciding if an email is spam or not; credit agencies deciding if a customer is creditworthy.
Key Algorithms:
- Logistic Regression
- k-Nearest Neighbors (k-NN)
- Support Vector Machine (SVM)
- Decision Tree
2.1.2 Regression
Regression is a supervised learning problem where the output is a continuous value. The goal is to predict a number based on input data.
Example:
How much will a house cost if it’s $x$ sq. meters, has $y$ bedrooms, and is $z$ km from downtown?
Key Algorithms:
- Linear Regression
- Ridge Regression
- Lasso Regression
- Decision Tree Regression
2.2 Unsupervised Learning
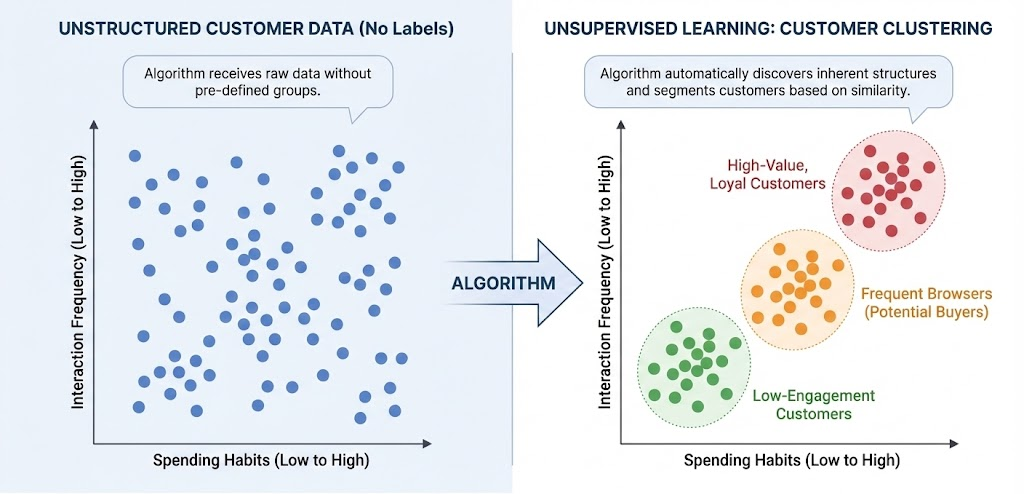
Unsupervised Learning is where the training data has no labels. The algorithm relies on the structure of the data itself to perform a task, like clustering or dimensionality reduction.
Supervised learning is great when you have the answers (labels). Unsupervised learning is for when you don't, and you need to discover hidden patterns.
Applications:
It's often used in exploratory data analysis, customer segmentation, anomaly detection, and data preprocessing.
There are two main types of Unsupervised learning problems:
2.2.1 Clustering
Grouping the entire dataset $X$ into clusters based on similarities.
Example: Customer Segmentation
Suppose we have data on thousands of customers (age, income, shopping frequency). We don't have labels telling us "this is a VIP customer." Unsupervised algorithms can automatically group these customers based on similarities, helping businesses identify segments without prior knowledge.
Key Algorithms:
- K-means
- Hierarchical Clustering
- DBSCAN
2.2.2 Association Rules
Mining frequent relationships or rules between objects in the data.
Example:
Male customers who buy clothes also tend to buy watches or belts; people who watch Spider-Man also tend to watch Batman. This is the basis of Recommendation Systems.
Key Algorithms:
- Apriori
- FP-Growth
- Eclat
2.3 Semi-supervised Learning
Semi-supervised Learning sits between supervised and unsupervised. The training set has a small amount of labeled data and a large amount of unlabeled data. The goal is to use the unlabeled data to get better results than labeled data alone.
Example:
In handwriting recognition, maybe we only have a few labeled digit images and tons of unlabeled ones. A semi-supervised algorithm uses the labeled ones to guide the learning, while exploiting the structure of the unlabeled ones to improve accuracy.
Applications:
Great for when labeling data is expensive or time-consuming (like medical imaging).
Key Algorithms:
- Self-training (Pseudo-labeling)
- Label Propagation
2.4 Reinforcement Learning
Reinforcement Learning is where an agent learns to make decisions by interacting with an environment. Instead of labeled data, the agent gets a reward or penalty for its actions, eventually learning a strategy to maximize rewards.
Example: Robot Learning to Move
A robot is placed in a maze. It doesn't know the way out. It gets a reward for moving closer to the exit and a penalty for hitting a wall. Through trial and error, it figures out the optimal path.
Applications:
Used in robotics, game playing (like AlphaGo), and automated systems where real-time decision-making is needed.
Key Algorithms:
- Q-learning
- SARSA
- Deep Q-Network (DQN)
Chapter 3: A 4-Step Roadmap for Beginners
For beginners, "Machine Learning" can feel shrouded in a fog of dry math and complex algorithms. It’s intimidating. But the truth is, you don’t need to be a math genius to get started.
With the right roadmap, balancing theory and practice, you can build a solid foundation in just a few months. Here is a standard 4-step path used by top data science programs.
3.1. Step 1: Prep Your Arsenal – Math and Programming
Machine Learning is where Computer Science meets Statistics. You need to understand your tools, not just memorize commands.
📐 Mathematics: The Foundation
Focus on 3 main pillars:
- Linear Algebra: The language of data.
- Why? Computers see numbers in matrices, not images.
- Focus: Vectors, Matrices, Matrix Multiplication. This is key for Neural Networks.
- Calculus: The engine of optimization.
- Why? It explains how models learn by minimizing error.
- Focus: Derivatives, Chain Rule, Gradient Descent.
- Probability & Statistics: Handling uncertainty.
- Why? Helps you evaluate if your model is actually good or just lucky.
- Focus: Distributions, Probability, Hypothesis Testing.
💻 Programming: The Tool
Python is the king of AI right now.
* Basics: Variables, functions, loops, data structures.
* The Big Three:
* NumPy: Number crunching.
* Pandas: Data manipulation (like Excel on steroids).
* Matplotlib / Seaborn: Visualization.
3.2. Step 2: Master the Mindset & Intro Algorithms
Learn to think like an ML engineer. Distinguish between Supervised (answers provided) and Unsupervised (finding patterns).
Know your enemies:
* Overfitting: Memorizing the test answers but failing the real exam.
* Underfitting: Not studying enough to understand the subject.
Start with 4 classic algorithms:
1. Linear Regression
- Type: Supervised (Regression).
- Gist: Drawing the best-fit line through data points.
- Use: Predicting prices, revenue.
2. Logistic Regression
- Type: Supervised (Classification).
- Gist: Despite the name, it's for classification (Yes/No).
- Use: Spam filtering, churn prediction.
3. Decision Tree
- Type: Supervised.
- Gist: A flowchart of questions to make a decision.
- Use: Medical diagnosis, credit risk.
4. K-Means Clustering
- Type: Unsupervised.
- Gist: Grouping similar things together.
- Use: Customer segmentation.
3.3. Step 3: Hands-on with Scikit-Learn
Theory is useless without practice. Scikit-Learn is your best friend here.
- Standard Workflow:
- Preprocess Data (Clean it up).
- Split Data (Train vs. Test).
- Train Model (
model.fit()). - Evaluate (
model.predict()).
- Projects: Titanic Survival, Iris Classification, House Prices.
3.4. Step 4: Level Up to Deep Learning
Once you're comfortable with the classics, jump into Deep Learning.
- Neural Networks: Mimicking the brain.
- Frameworks: TensorFlow or PyTorch.
- Fields: Computer Vision, NLP.
Chapter 4: Exploring the Libraries
Python has an ecosystem of libraries for everything. Here are the 4 you must know.
- NumPy
- Pandas
- Matplotlib/Seaborn
- Scikit-learn
4.1. NumPy - The Math Wizard
4.1.1. Definition
NumPy handles the heavy lifting for numerical calculations. It turns data into numbers the machine can understand.
4.1.2. Examples
Ex 1: Creating an Array
import numpy as np

arr = np.array([1, 2, 3, 4, 5])
print(arr)
Ex 2: Matrix Multiplication
import numpy as np

A = np.array([[1, 2], [3, 4]])
B = np.array([[5, 6], [7, 8]])
C = A @ B
print(C)
4.2. Pandas - The Excel Killer
4.2.1. What is it?
Data usually comes in tables (CSV, Excel). Pandas lets you read, clean, and analyze this data efficiently. The core structure is the DataFrame.
| id | name | age | salary |
|---|---|---|---|
| 1 | An | 22 | 500 |
| 2 | Binh | 35 | 1200 |
Real-world data is messy (missing values, typos). Pandas helps you fix that.
4.2.2. Examples
Ex 1: Creating a DataFrame
import pandas as pd

data = {
    "name": ["An", "Binh", "Chi", "Dung"],
    "age": [22, 35, 28, 42],
    "salary": [500, 1200, 800, 1500]
}

df = pd.DataFrame(data)
print(df)
Ex 2: Quick Stats
df.describe()
4.3. Matplotlib / Seaborn - The Artists
4.3.1. What are they?
They transform boring numbers into beautiful charts. Visualizing your data is key to understanding it.
4.3.2. Examples
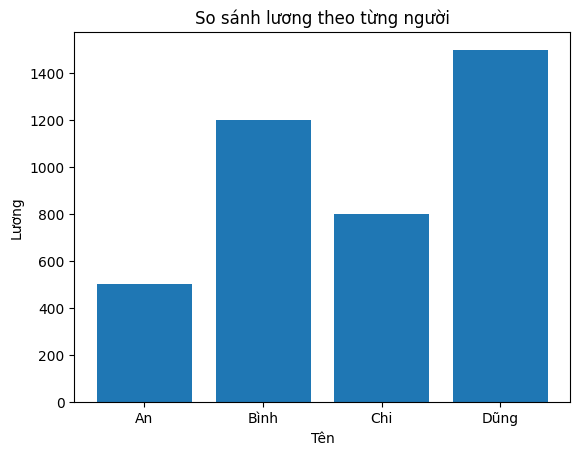
Ex 1: Bar Chart
import matplotlib.pyplot as plt

names = ["An", "Binh", "Chi", "Dung"]
salary = [500, 1200, 800, 1500]

plt.bar(names, salary)
plt.xlabel("Name")
plt.ylabel("Salary")
plt.title("Salary Comparison")
plt.show()
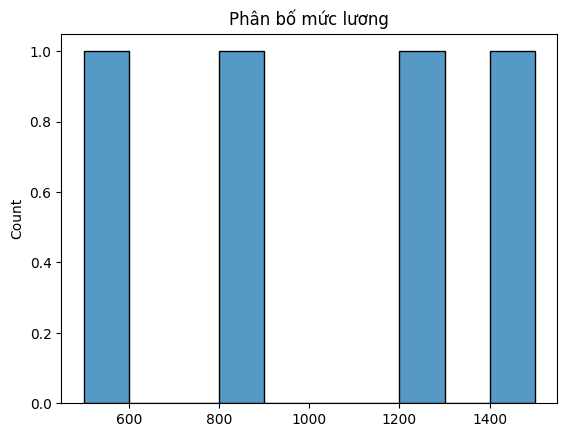
Ex 2: Distribution
import seaborn as sns

sns.histplot(salary, bins=10)
plt.title("Salary Distribution")
plt.show()
4.4. Scikit-learn – The ML Workhorse
4.4.1. What is it?
Scikit-learn (sklearn) provides all the basic algorithms and tools you need to train models. It’s the go-to for classical ML.
4.4.2. The Workflow
- Prepare Data (X, y)
- Split Train/Test
- Choose Model
- Train
- Evaluate
4.4.3. Examples
Ex 1: Regression (Predicting Salary)
from sklearn.linear_model import LinearRegression
import numpy as np

X = np.array([[22], [35], [28], [42]]) # age
y = np.array([500, 1200, 800, 1500])   # salary

model = LinearRegression()
model.fit(X, y)
print(model.predict([[30]]))
Ex 2: Classification (Pass/Fail)
from sklearn.linear_model import LogisticRegression

X = [[5], [6], [7], [8], [9]]
y = [0, 0, 0, 1, 1]

model = LogisticRegression()
model.fit(X, y)
print(model.predict([[7.5]]))
Chapter 5: Recommended Courses
If you need a structured path, here are my top picks.
5.1. Machine Learning Specialization – Andrew Ng
(DeepLearning.AI / Coursera)
The gold standard. Andrew Ng is a master at explaining concepts simply. It’s been recently updated to Python. Great for building a strong foundation.
5.2. Google Machine Learning Crash Course (MLCC) – Free
Fast-paced, practical, and free. Great if you already know some Python and want to dive in immediately. Google recently updated it with modern content.
5.3. Kaggle Learn – Intro to Machine Learning (Free)
"Learn by doing." Short modules that get you coding immediately. You can finish the Intro course in about 3 hours. Highly recommended if you hate long lectures.
5.4. Conclusion
Don't try to learn everything at once. Pick a path and stick to it. The most important thing is to start building.
Chapter 6: Project - Titanic Survival Prediction
Let’s solve a classic problem: Predicting who survived the Titanic.
This is a Classification problem based on age, class, gender, etc.
🔗 Source Code: Titanic Classification Colab
Typically, we follow these 5 steps:
1. Collect Data
2. Clean Data
3. Split Data
4. Train Model (Random Forest)
5. Evaluate
Step 1: Get the Data
import pandas as pd
import seaborn as sns
import matplotlib.pyplot as plt

df = sns.load_dataset('titanic')
print(df.head())
print(df.info())
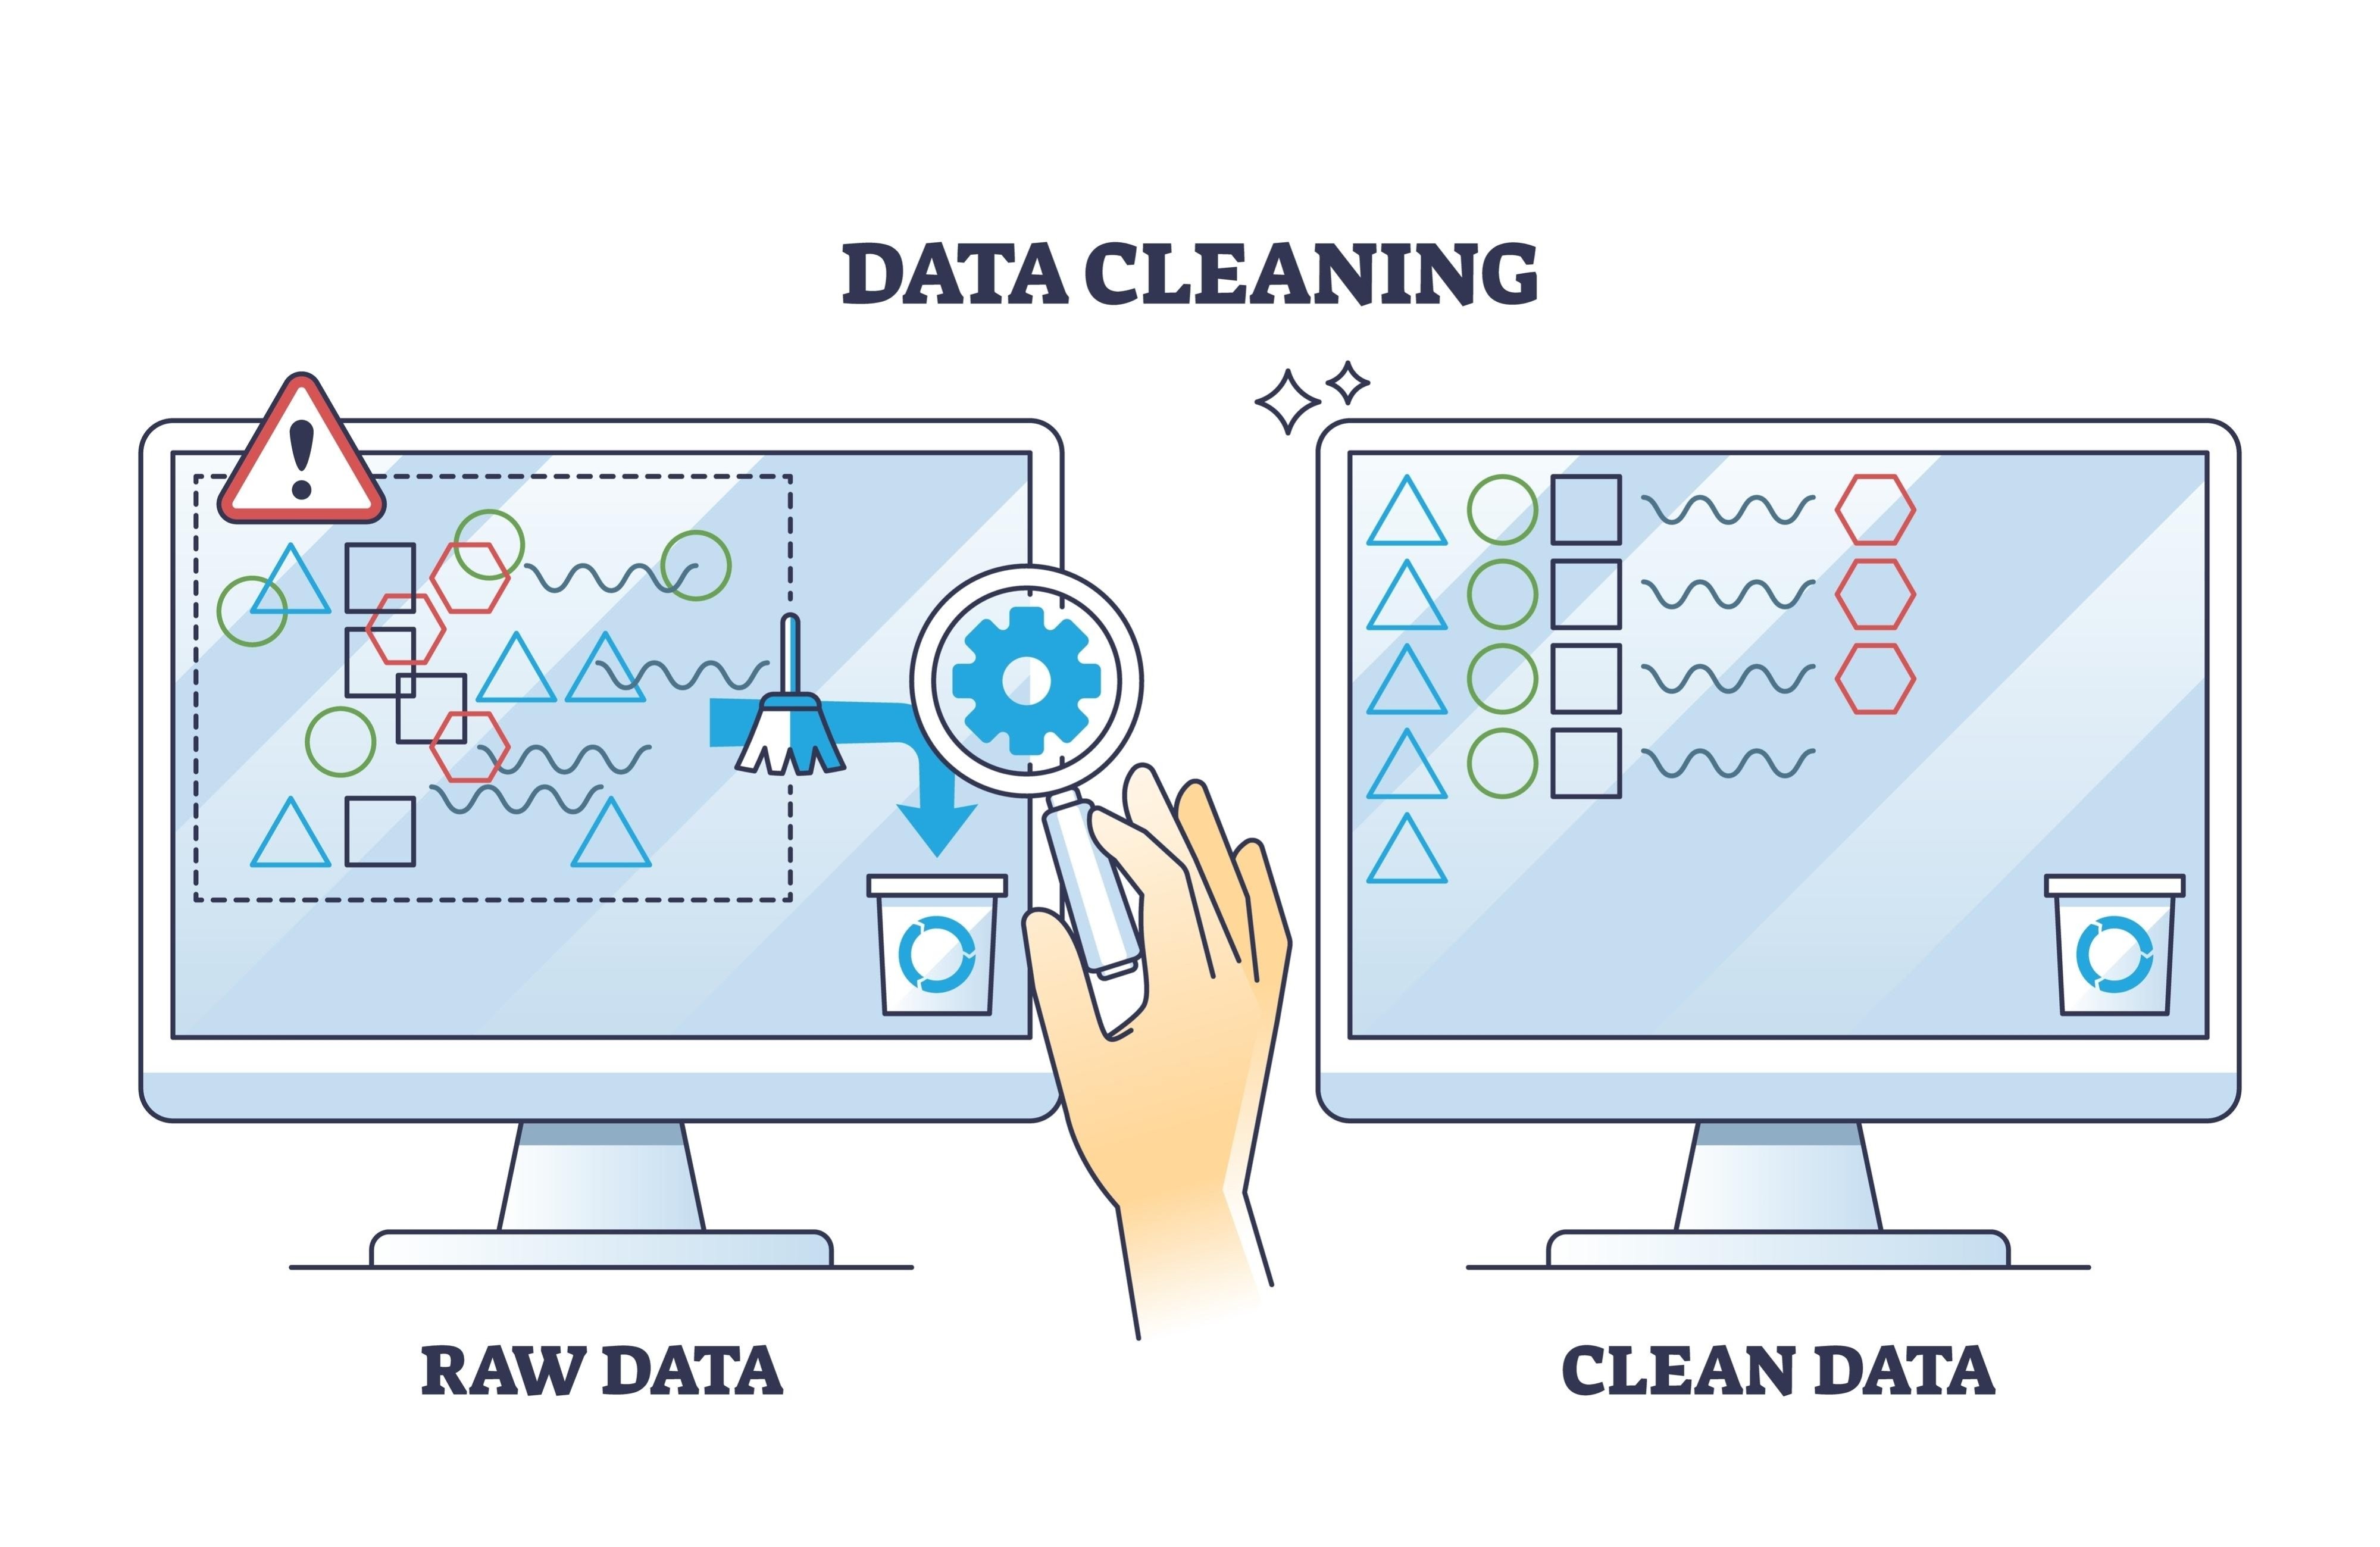
Step 2: Clean the Data
"Garbage In, Garbage Out." We need to fix missing values and turn text into numbers.
# Fill missing age with median
df['age'] = df['age'].fillna(df['age'].median())
df['embarked'] = df['embarked'].fillna(df['embarked'].mode()[0])

# Drop useless columns
df = df.drop(columns=['deck', 'embark_town', 'alive', 'class', 'who', 'adult_male'])

# Encode
df['sex'] = df['sex'].map({'male': 0, 'female': 1})
df = pd.get_dummies(df, columns=['embarked'], drop_first=True)
Step 3: Split
80% for training, 20% for testing.
from sklearn.model_selection import train_test_split

X = df.drop('survived', axis=1)
y = df['survived']

X_train, X_test, y_train, y_test = train_test_split(X, y, test_size=0.2, random_state=42)
Step 4: Train (Random Forest)
We'll use a Random Forest, which is basically a collection of many decision trees voting on the outcome.
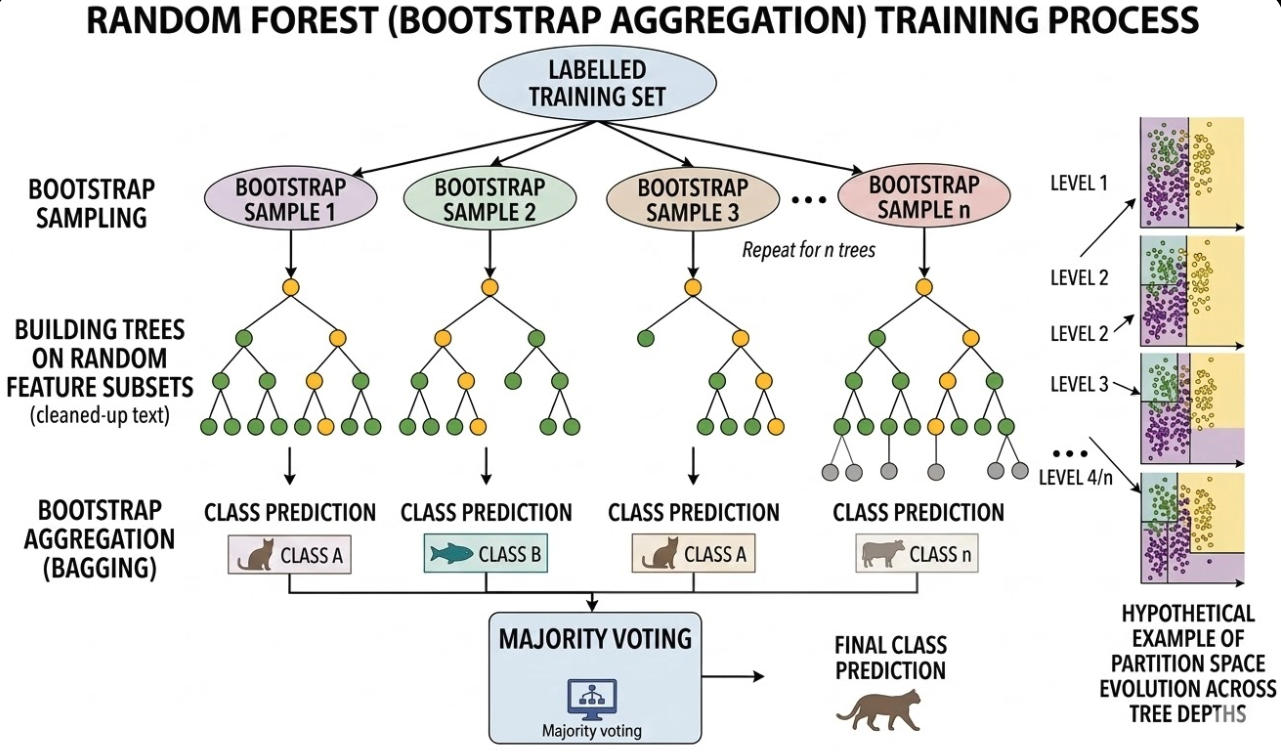
from sklearn.ensemble import RandomForestClassifier

model = RandomForestClassifier(n_estimators=100, random_state=42)
print("Training...")
model.fit(X_train, y_train)
print("Done!")
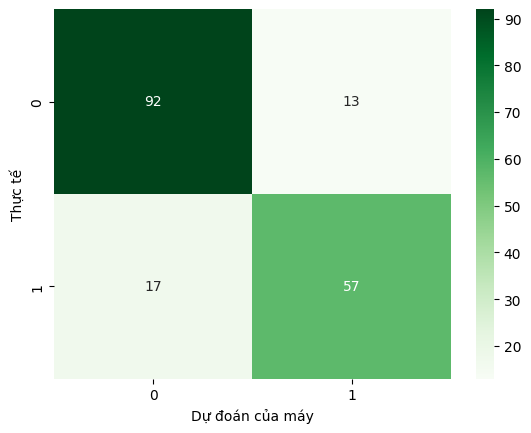
Step 5: Evaluate
Did it work? Let's check the accuracy.
from sklearn.metrics import accuracy_score, classification_report, confusion_matrix

y_pred = model.predict(X_test)

acc = accuracy_score(y_test, y_pred)
print(f"Accuracy: {acc*100:.2f}%")

print(classification_report(y_test, y_pred))

cm = confusion_matrix(y_test, y_pred)
sns.heatmap(cm, annot=True, fmt='d', cmap='Greens')
plt.show()
Conclusion: Clean data + Good Algorithm = Success.
Thanks for reading! If you have questions, drop a comment below.
Happy coding! 🚀
References
- Mitchell, T. M. (1997). Machine Learning. McGraw-Hill.
- Scikit-learn Developers. Scikit-learn: Machine Learning in Python.
- The Pandas Development Team. pandas documentation.
- Hunter, J. D. (2007). "Matplotlib: A 2D graphics environment". Computing in Science & Engineering.
- DeepLearning.AI & Andrew Ng. Machine Learning Specialization.
- Google Developers. Machine Learning Crash Course.
- Kaggle. Intro to Machine Learning.
- Kaggle Datasets. Titanic - Machine Learning from Disaster.
- Breiman, L. (2001). "Random Forests". Machine Learning, 45(1), 5-32.
Chưa có bình luận nào. Hãy là người đầu tiên!