
1. What is Anomaly Detection? – When "Outliers" Speak Up
In the world of Data Science, we often spend most of our time searching for common patterns—the rules that help models understand the majority. However, sometimes the "deviants," the data points that stray from the crowd, are exactly where the most valuable insights are hidden. This is the realm of Anomaly Detection.
In technical terms, Anomaly Detection is the process of identifying data points (observations) that possess distribution characteristics significantly different from the rest of the dataset. In statistics, we call these Outliers.
However, it is crucial to distinguish: Anomaly is not merely Noise.. While noise represents random errors that should be removed during the preprocessing phase (Data Cleaning), an Anomaly is a genuine signal. it signals a sudden change, a rare event, or a specific behavior within the system that demands attention.
 Figure 1.1. Illustration of Anomaly Detection; source: Gemini
To see the critical importance of these "strays," let’s look at real-world scenarios:
- Financial Transactions: Suppose your spending history revolves around cafes and supermarkets in Vietnam with a limit under $100. Suddenly, a $5,000 transaction for jewelry in London appears. The algorithm will immediately flag this anomaly to prevent potential account takeover.
- Cybersecurity: A server is operating stably when it suddenly receives an exponential spike in requests within seconds. This isn't just organic user growth; it is the fingerprint of a DDoS attack threatening to crash the infrastructure.
- Industrial IoT: In a production line, vibration sensors send back steady signals. A minute change in wave amplitude might be the "cry for help" from a failing bearing, allowing for maintenance before a catastrophic machine breakdown occurs.
2. The Importance of Anomaly Detection and its Applications
2.1. Why is Anomaly Detection Important?
With the continuous development of modern society, data plays a crucial role in representing the growth and operation of many fields. The rapid increase in data also leads to a higher risk of errors and anomalies. Early detection of these anomalies can help organizations and businesses quickly address data-related issues, allowing them to implement appropriate upgrades, maintenance strategies, and optimize operational costs. Through anomaly detection, several benefits can be achieved such as:
- Fraud detection
- System error detection
- Cyberattack detection
2.2. Applications of Anomaly Detection
2.2.1. Financial Fraud Detection
In the financial sector, detecting anomalies in transactions can help organizations quickly identify fraudulent activities. This enables businesses to protect customers and minimize the risk of financial losses. Some specific applications include:
Transaction fraud: The intentional use of stolen financial information to conduct unauthorized purchases or money transfers. By analyzing anomalies in transaction data, banks can intervene promptly and prevent suspicious or unauthorized transactions for customers.
Credit card fraud: Personal credit information can easily be stolen. Therefore, anomaly detection can be applied to track credit transactions originating from unusual IP addresses or transactions that are unusually large compared to normal behavior. Banks can then block these transactions to protect cardholders and reduce financial losses.
2.2.2. Cybersecurity
In cybersecurity, detecting suspicious access patterns or abnormal requests can help identify existing security vulnerabilities. This enables organizations to prevent cyberattacks in a timely manner and enhance the security of computer network systems.
Network intrusion: By monitoring abnormal network traffic associated with a connection, the system can generate alerts for administrators and prevent unauthorized network intrusions.
Abnormal login activity: This refers to login attempts from unknown sources, unauthorized users, or new devices. By identifying these unusual login activities, the system can notify users about potential security risks to their accounts.
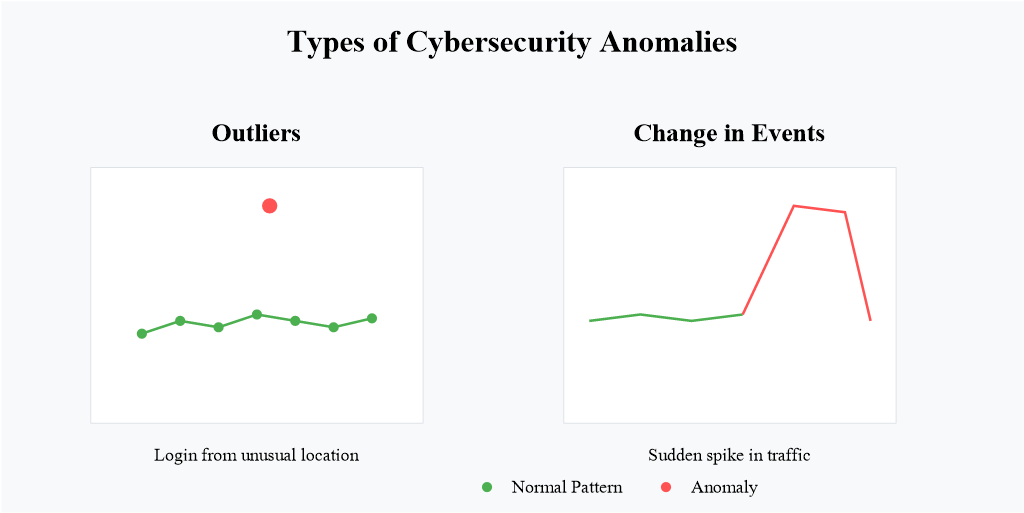 Figure 2.1. Anomaly in cybersecurity; source: Wiz
2.2.3. Industrial Monitoring
In industrial machine systems, devices may produce incorrect readings over time. Early detection of abnormal sensor data can help businesses identify the root cause and fix the issue promptly, ensuring the stability of the entire system.
Machine failure: A malfunction in any component of a manufacturing machine can affect other equipment. For example, if the laser system in a laser cutting machine fails, it may generate excessive heat beyond the allowed threshold, causing inaccurate readings from temperature sensors. Detecting anomalies in data recorded by these devices can help companies trace underlying problems and improve maintenance processes.
Control errors: In control systems, motor-related data can reflect the accuracy of the controller. Analyzing this data can help identify limitations in the current design and optimize the system.
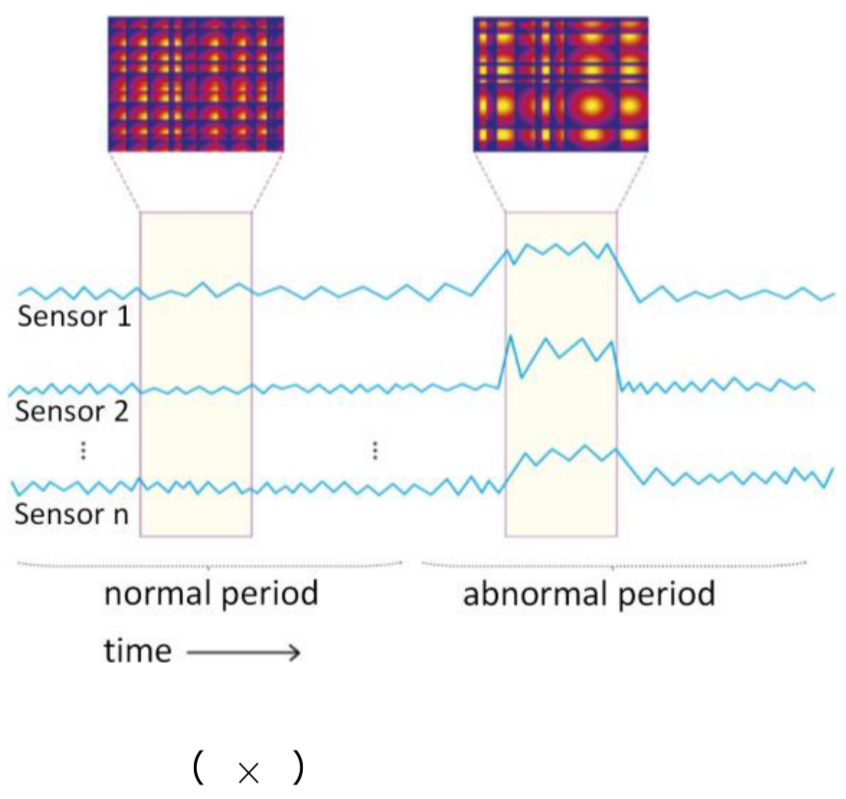 Figure 2.2. Anomaly in sensor data; source: TheMoonlight
2.2.4. Healthcare
In the healthcare sector, patient data plays a crucial role in monitoring health conditions. By analyzing this data, doctors can track changes in a patient’s health status and provide timely medical solutions.
Medical data: Data such as abnormal cholesterol levels or blood pressure can help doctors screen for potential diseases, supporting diagnosis and prevention.
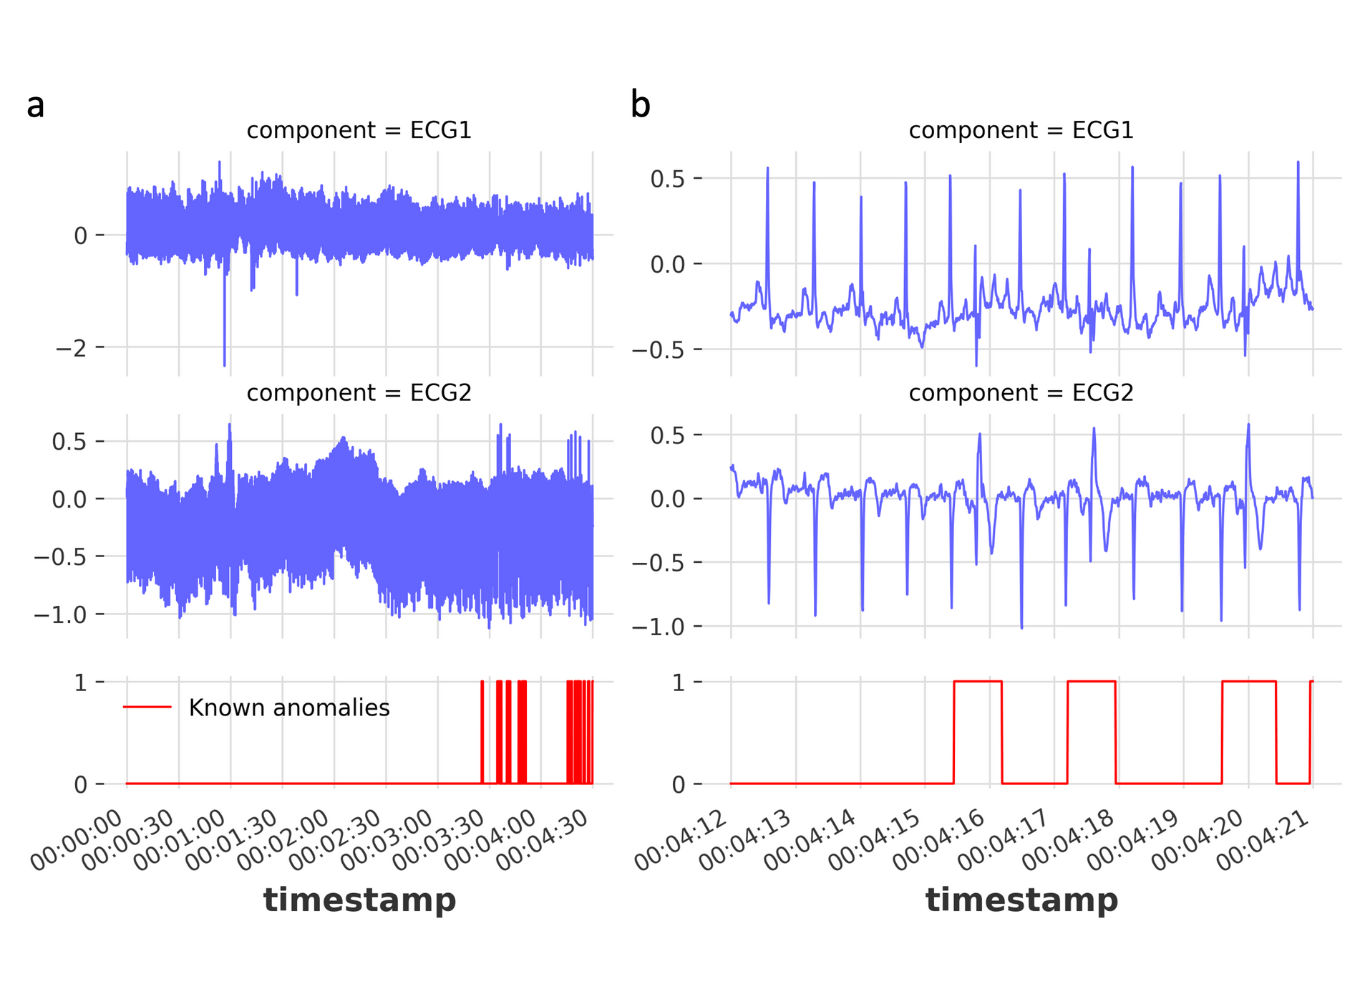 Figure 2.3. Anomaly in medical data; source: Unit8
3. Types of anomalies
In data science, choosing the appropriate method for handling anomalies requires understanding them from two perspectives: the causes that generate them and how they appear within a dataset.
3.1. Classification by Cause
Anomaly detection systems typically identify two main types of anomalies: unintentional anomalies and intentional anomalies.
3.1.1. Unintentional anomalies
Unintentional anomalies are data points that deviate from the norm due to errors or noise in the data collection process. These errors can be either systematic or random, originating from issues like faulty sensors or human error during data entry. Unintentional anomalies can distort the data set, making it challenging to derive accurate insights.
Examples:
-
Data collection error: A data entry employee accidentally types an extra “0”, turning a transaction of 1.000.000 VND into 10.000.000 VND.
-
Hardware failure: A temperature sensor short-circuits during heavy rain and reports a reading of 100 °C to the system.
-
Random event: A social media post suddenly goes viral, causing traffic or mentions to increase several times above the normal level.
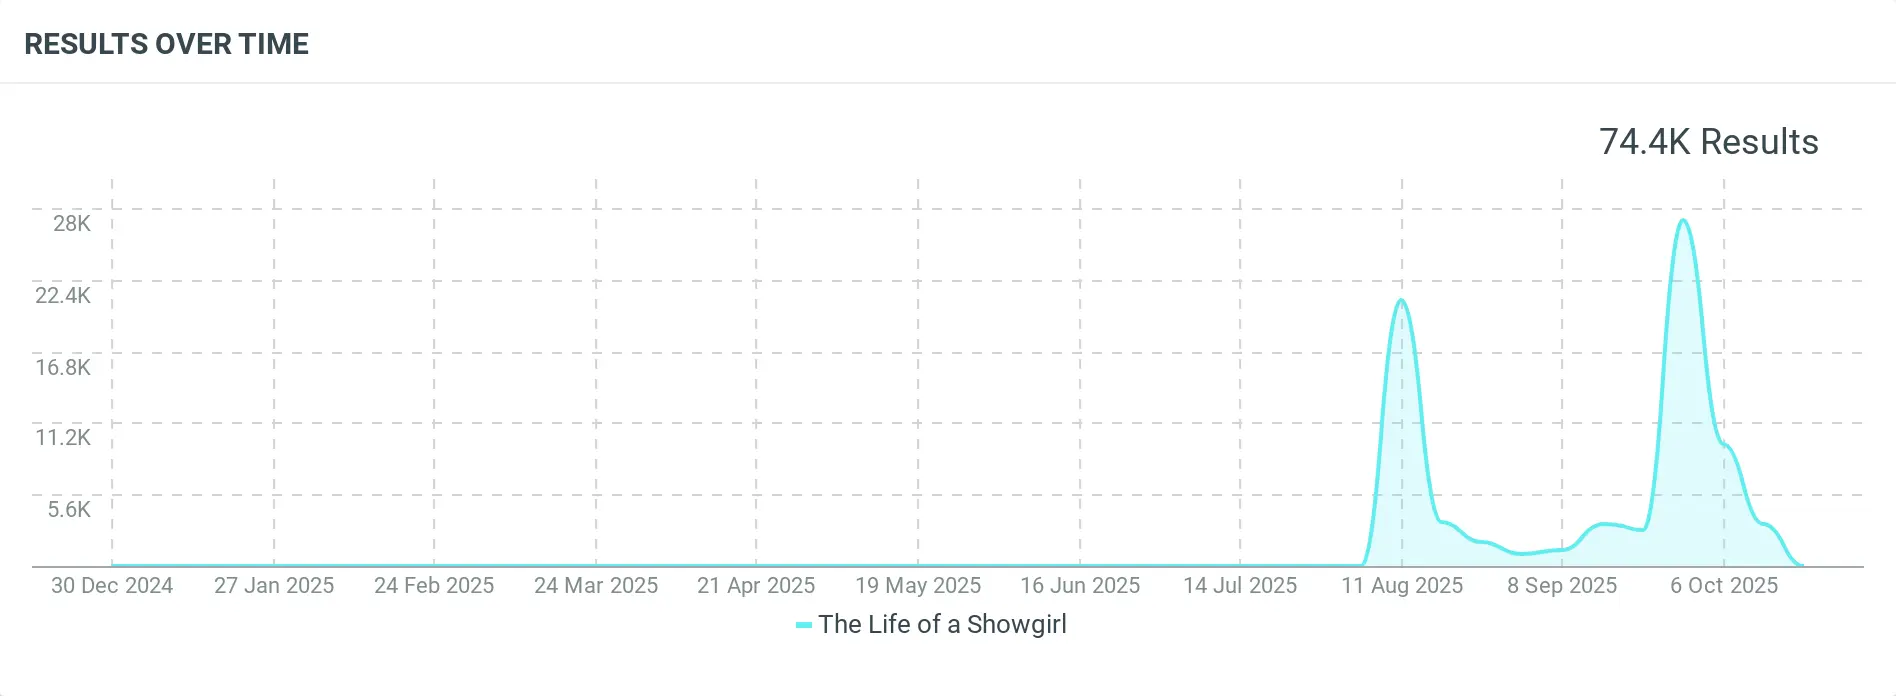 Figure 3.1. A song suddenly goes viral, leading to a sharp spike in mentions; source: Talkwalker Social Listening
3.1.2. Intentional anomalies
Intentional anomalies are data points that deviate from the norm due to specific actions or events. These anomalies can provide valuable insights into the data set, as they may highlight unique occurrences or trends. For example, a sudden spike in sales during a holiday season could be considered an intentional anomaly, as it deviates from the typical sales pattern but is expected due to a real-world event.
For example, a sudden spike in sales during a promotional campaign or holiday season may appear anomalous when compared to regular sales patterns. However, this increase is expected because it is driven by a planned event and often prepared for in advance.
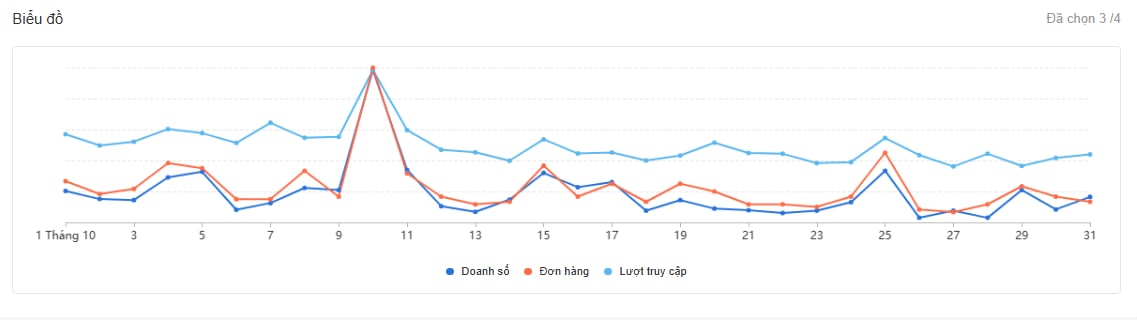 Figure 3.2. A spike in sales during a promotional campaign, an example of intentional anomalies in data.
3.2 Classification by Data Manifestation
Another important aspect of anomaly detection is the nature of the anomaly itself—specifically, how it appears within the dataset. Based on their manifestation in the data, anomalies are commonly categorized into three main types:
3.2.1. Point Anomalies
A point anomaly occurs when a single data point deviates significantly from the rest of the dataset. In simpler terms, if a single observation appears clearly different from other observations, it can be considered a point anomaly.
This is the simplest and most widely studied type of anomaly in anomaly detection research. The reason is that such anomalies are relatively intuitive: detecting them often involves comparing an individual data point with the overall distribution of the dataset to determine whether it falls outside the normal range.
In the figure below, points such as $o_1$, $o_2$, or points located in region $O_3$ are typically considered anomalous because they lie outside the boundary of the normal data region. Therefore, they are classified as point anomalies.
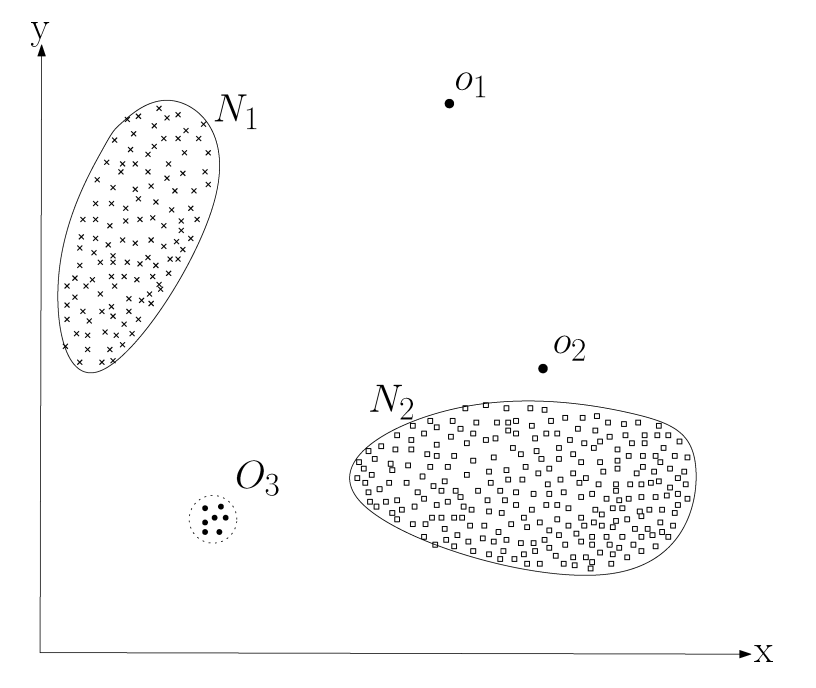 Figure 3.3. A simple illustration of anomalous points in a two-dimensional dataset; source: Chandola, Banerjee, and Kumar (2009) – Anomaly Detection: A Survey
A common real-world example of a point anomaly appears in credit card fraud detection systems. For instance, a customer may typically spend between 200.000 and 1.000.000 VND per transaction. If a transaction of 30.000.000 VND suddenly occurs, it deviates significantly from the user's historical spending pattern. Such a transaction may therefore be flagged as a point anomaly for further investigation.
3.2.2. Contextual Anomalies
A data point is considered a contextual anomaly when it appears anomalous only within a specific context but not in other contexts. This type of anomaly is also referred to as a conditional anomaly (Song et al., 2007).
The notion of a context is induced by the structure in the data set and has to bespecified as a part of the problem formulation. Each data instance is defined using thefollowing two sets of attributes:
**(1) Contextual attributes **
Contextual attributes define the context or neighborhood in which a data point is observed.
Examples:
-
In spatial data, the longitude and latitude of a location serve as contextual attributes.
-
In time-series data, time acts as a contextual attribute because it determines the position of an observation within the sequence.
(2) Behavioral attributes
Behavioral attributes describe the actual characteristics or measurements of a data point, independent of the context.
Example:
- In a spatial dataset describing average rainfall across the world, the rainfall amount at each location is a behavioral attribute.
Determining whether a data point is anomalous depends on the value of its behavioral attributes within a specific context. A data point may be considered anomalous in one context but completely normal in another, even if its behavioral value remains the same. This distinction between contextual and behavioral attributes is fundamental to contextual anomaly detection methods.
The figure below illustrates such a scenario using a temperature time series that represents monthly temperatures in a region over several years. A temperature of 35°F may be normal during winter (at time $t_1$) in that region, but the same value during summer (at time $t_2$) would be considered anomalous.
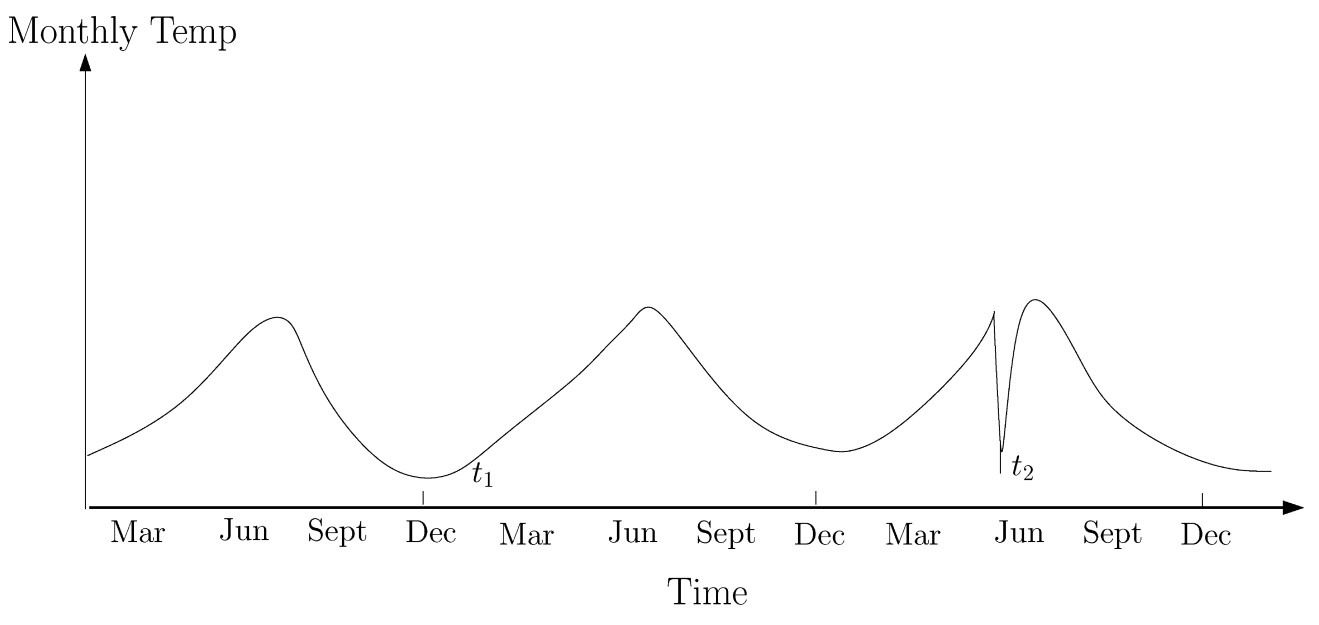 Figure 3.4. Example of contextual anomalies in a temperature time series. source: Chandola, Banerjee, and Kumar (2009) – Anomaly Detection: A Survey
3.2.3. Collective Anomalies
A collective anomaly occurs when a group of related data points is considered anomalous with respect to the entire dataset. In this case, individual data points may not appear anomalous when examined separately; however, their occurrence together as a group forms an unusual pattern.
The figure below illustrates an example from a human electrocardiogram (ECG) signal (Goldberger et al., 2000). The highlighted region is considered anomalous because the signal remains at a low value for an unusually long period, which corresponds to the phenomenon known as Atrial Premature Contraction. Note that the low value itself is not inherently anomalous; rather, the anomaly arises from the prolonged sequence of such values over time.
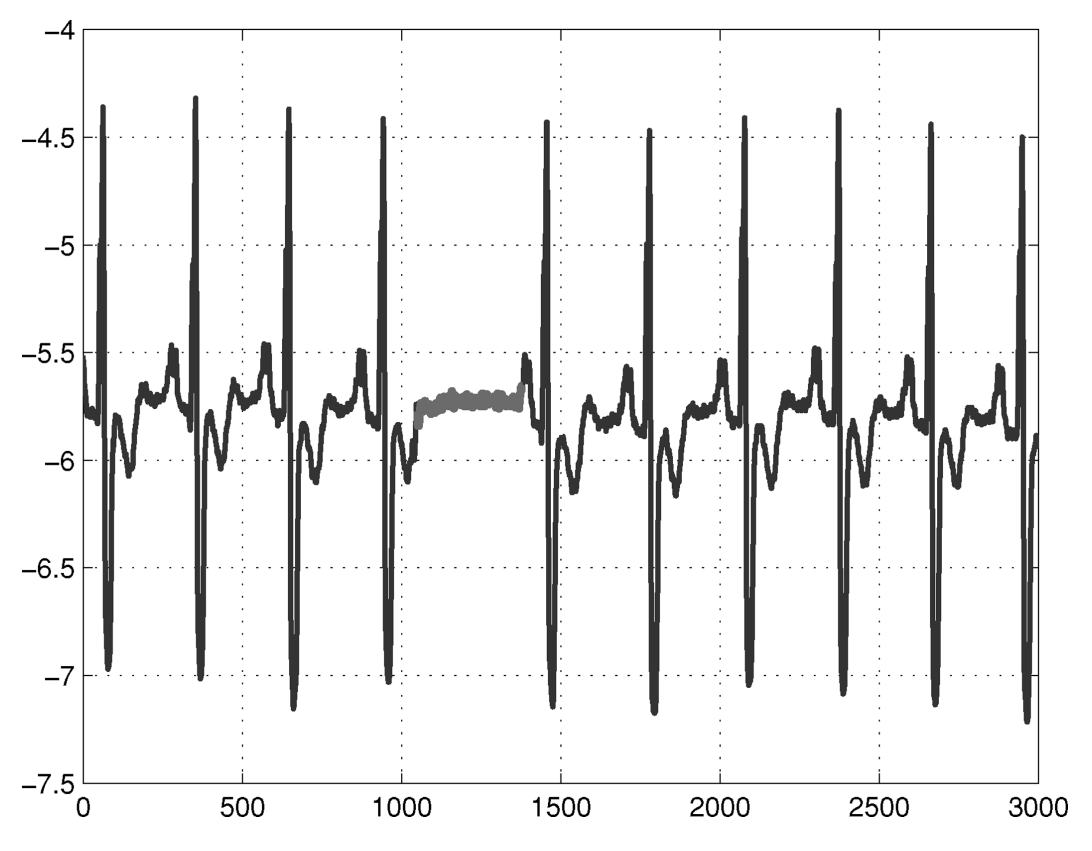 Figure 3.5. Example of a collective anomaly in an electrocardiogram (ECG) signal. source: Chandola, Banerjee, and Kumar (2009) – Anomaly Detection: A Survey
4. Common methods for Anomaly Detection
The rapid increase in data from various sources has made anomaly detection increasingly essential for identifying unusual observations that may signal system errors, security breaches, or fraud. Currently, there are many anomaly detection methods, ranging from simple to complex, and from traditional to modern. Each method has its own advantages and disadvantages. Depending on the type of data and the purpose, businesses and organizations will choose the most suitable method.
The following sections will introduce methods such as data visualization, statistical testing, traditional machine learning, modern deep learning, and methods combining both traditional and deep learning algorithms.
4.1. Data Visualization
Using visual representations for anomaly detection is a key method when there is a need to quickly identify unusual data patterns, explain why a data point is considered anomalous, or monitor complex systems in real time.
Here are some specific times and situations where you should use visual aids.
4.1.1. Data Exploration Analysis (EDA) Phase
Before applying machine learning algorithms, visual representations help you better understand the state of the data.
- Identifying Outliers: Use Box Plots to see points outside the standard range of values or Scatter Plots to detect data points that are distinctly separate from the main data clusters.
- Identifying trends and cycles: Line charts are extremely useful for detecting sudden changes or disruptions in time-series data.
4.1.2. Model Validation and Interpretation
When an algorithm (like Isolation Forest) labels a point as an anomaly, visual representations help humans verify that finding.
- Explaining "Why": Tools like Power BI Anomaly Detection not only point out anomalies but also provide visual explanations of the influencing factors.
- Distinguishing True Anomalies from Noise: Images help professionals differentiate between genuine system errors and harmless, random incidents.
4.1.3. Real-Time System Monitoring
In cybersecurity or manufacturing, visual representations are the first line of defense.
- Intrusion & Fraud Detection: The dashboard displays network traffic in a graph-based format, allowing security engineers to immediately see suspicious connections highlighted in red.
- Industrial Equipment Monitoring: In manufacturing, charts showing the discrepancies between actual and predicted values help prevent machine failures before they occur.
4.1.4. Communication for Non-Technical Audiences
Visual representations are the best way to present complex findings to stakeholders.
- Business Reports: Charts help managers clearly see unusual sales declines without having to read through thousands of lines of spreadsheets.
- Making strategic decisions: Visualizing potential threats helps organizations develop more effective strategic responses.
4.2. Statistical Tests
When a solid mathematical foundation is needed to identify anomalies, and when machine learning methods become too complex or unnecessary, you may consider using statistical testing.
Below are specific times when statistical testing should be prioritized.
4.2.1. Data follows a defined distribution
If you know your data follows a specific distribution (such as a Normal/Gaussian distribution), statistical testing is the most powerful and accurate tool.
- Univariate data: Use the Z-Score to identify points that are far from the mean (usually > 3 standard deviations).
- Find outliers in normally distributed data: Z-test or T-test
- Compare the differences between the two datasets (before and after): Mann-Whitney U Test hoặc Kolmogorov-Smirnov Test
- Check for data dispersion/volatility: F-test
- Outlier Detection: Use specialized tests such as Grubbs' Test or Dixon's Q-test to find a single outlier in a small dataset.
4.2.2. Requirements for Transparency and Explainability
Unlike AI's "black box" models, statistical testing provides clear reasoning.
- Logical explanation: You can easily explain to stakeholders that "This point is unusual because it falls outside the 99% confidence interval of the historical distribution."
- Regulatory Compliance: In auditing or security, having a clear mathematical formula to demonstrate an anomaly is often preferred over complex algorithms.
4.3. Traditional Machine Learning
When your data starts to become more complex than simple statistical distributions, but still hasn't reached the level of massive size or unstructured data (like video/audio) that would require Deep Learning, then you'll need traditional Machine Learning algorithms.
Here are some specific scenarios for application.
4.3.1. High-Dimensional Data
When you have dozens or hundreds of interacting features, univariate statistical tests will fail. Algorithms like Isolation Forest or One-Class SVM are extremely effective at finding anomalies hidden deep within the combination of multiple variables that are invisible to the naked eye on a graph.
4.3.2. Unsupervised Learning (No Labeled Data)
One of the most common situations in practice today is having a lot of data but not knowing which is "error" and which is "clean." Unsupervised learning algorithms like Local Outlier Factor (LOF) will automatically learn the density of the data and flag points in sparse areas as anomalies.
4.3.3. The need for a balance between performance and resources
Deep learning methods are very powerful but extremely demanding on hardware and data.
Traditional machine learning runs faster, uses less RAM/CPU, and requires less training data to achieve acceptable accuracy in tasks such as credit card fraud detection or IoT device malfunction detection.
4.3.4. Data that does not follow a normal distribution
If your data has odd shapes, is multimodal, or lacks clear statistical patterns, distance/density-based algorithms like K-Nearest Neighbors (KNN) or DBSCAN will rely on the physical distance between points to identify anomalies instead of strict mathematical assumptions.
4.4. Deep Learning
The methods mentioned above have been widely used. However, when dealing with high-dimensional datasets or those with complex relationships, traditional methods prove ineffective. Deep learning models, capable of learning complex rules, are gradually becoming powerful tools to overcome these weaknesses.
Here are three approaches to deep learning modeling.
4.4.1. Reconstruction-based Approach
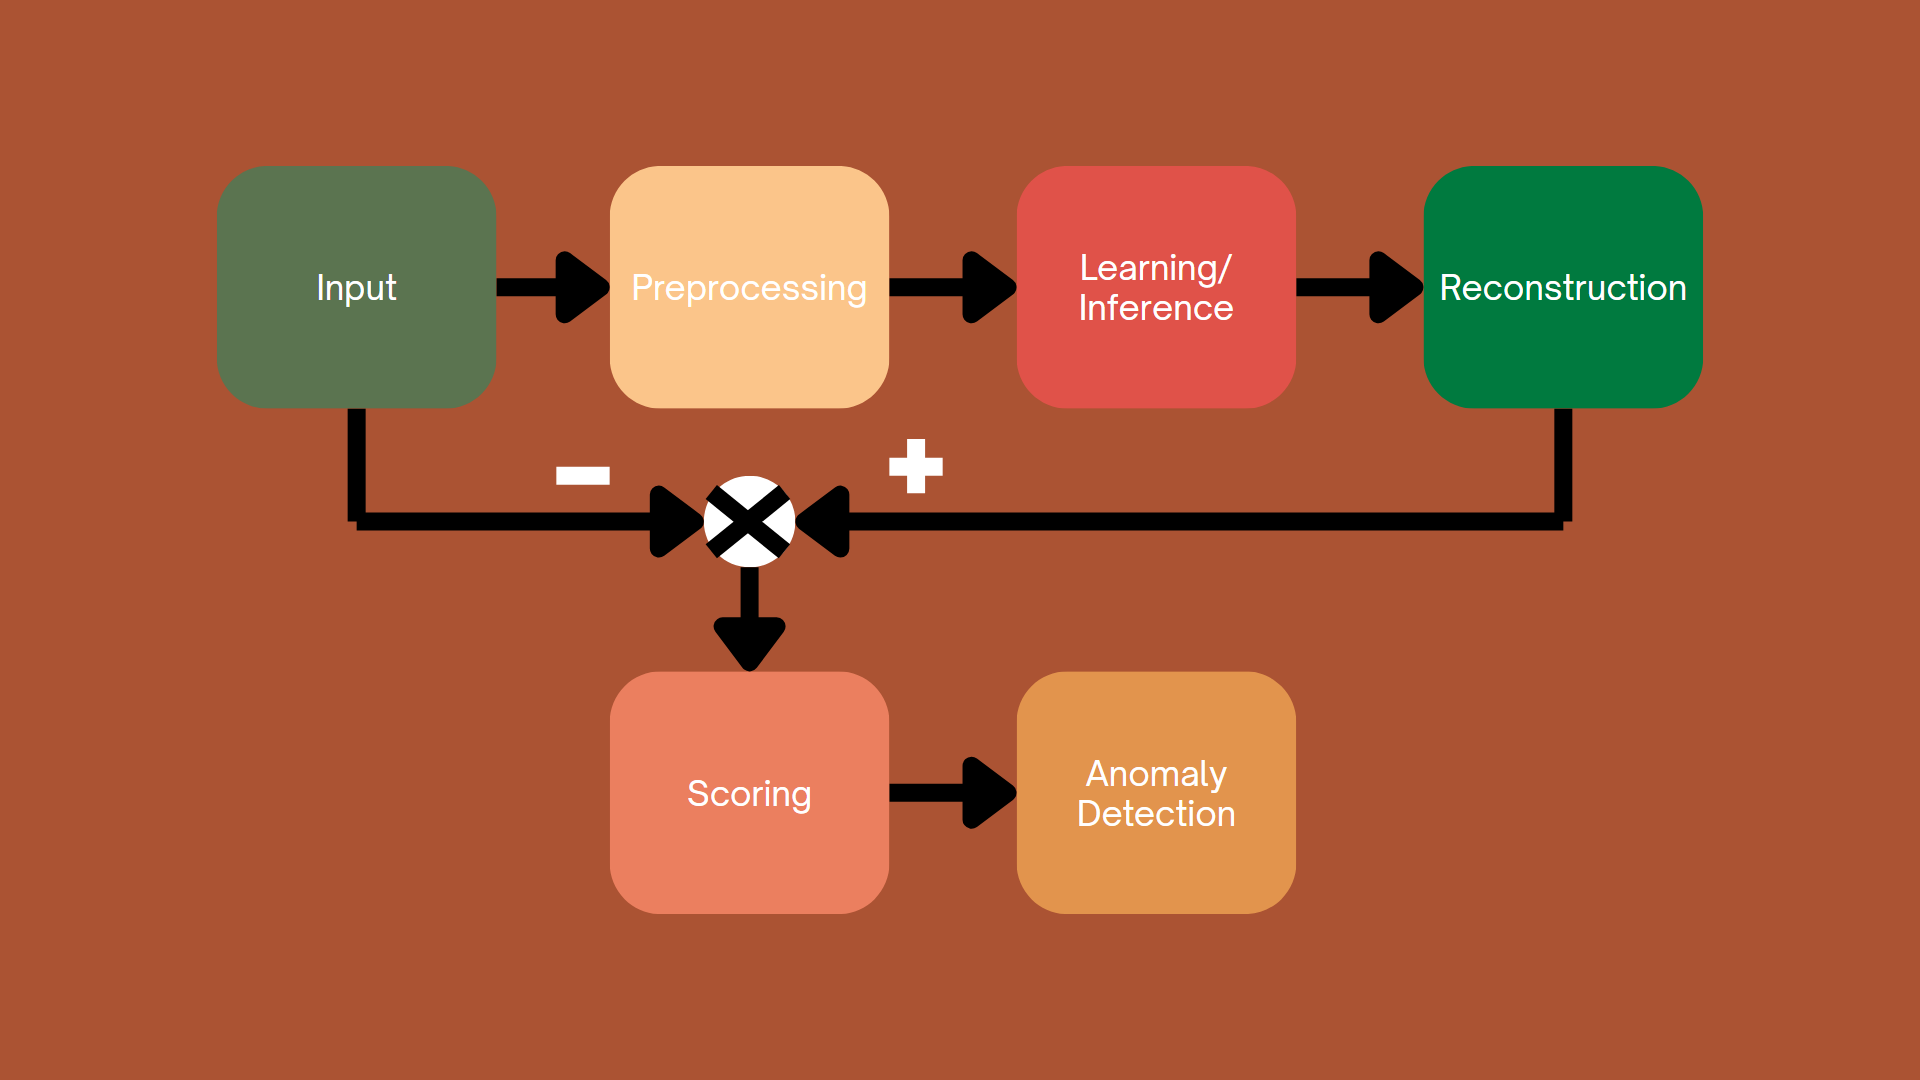 Figure 4.1. Reconstruction-based Approach.
This approach works by training a model to learn the distribution of normal (non-anomalous) data. After training, the model is able to reconstruct the input data. The difference between the original data and the reconstructed data is called the reconstruction error. A high error is an indicator that the data is anomalous.
In recent years, common approaches to modeling have included generative adversarial networks (GANs), autoencoder models, and diffusion models.
4.4.2. Prediction-Based Approach
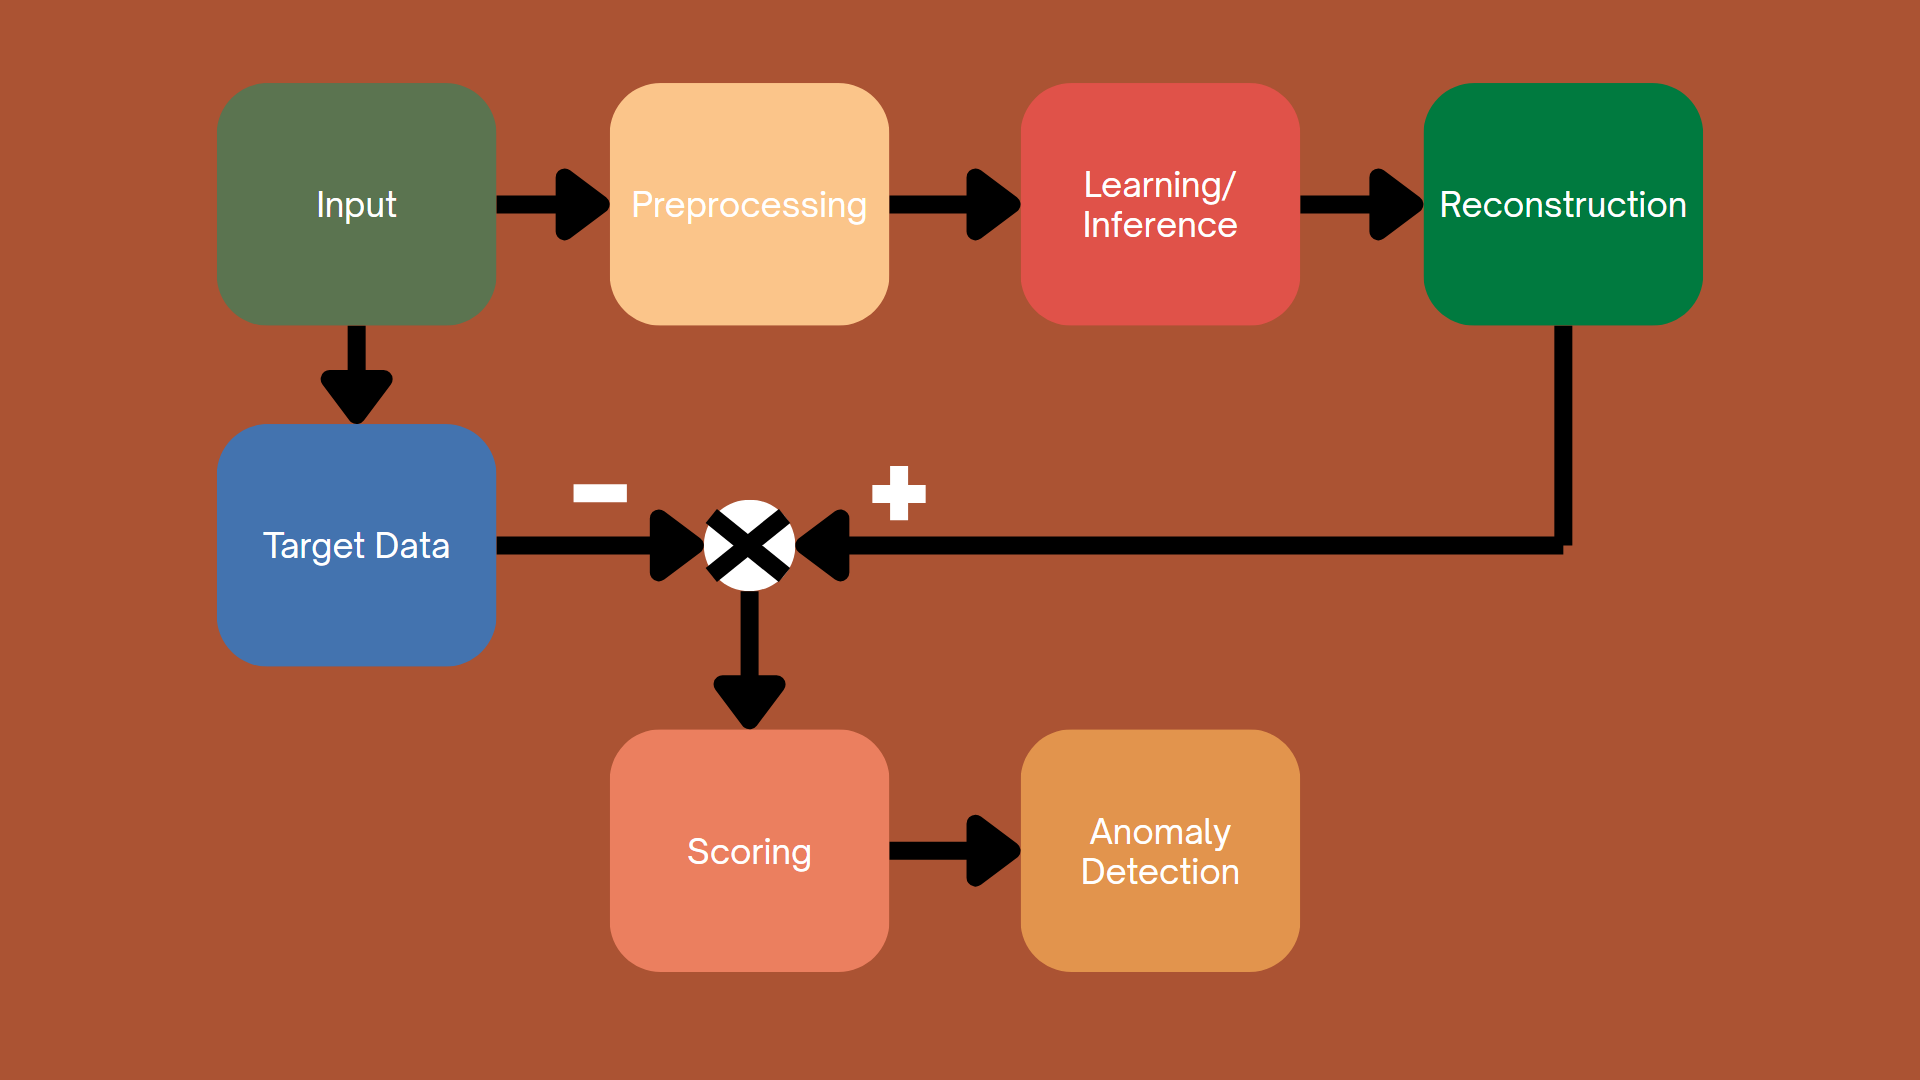 Figure 4.2. Prediction-Based Approach.
Prediction-based anomaly detection methods work by forecasting future values or estimating missing attributes, then comparing these predictions to the actual observed values. When significant deviations occur, it indicates anomalies, as the data deviates from learned standard patterns.
These methods are highly flexible and can be applied to a wide variety of data types, leveraging relationships between variables or correlations over time to detect anomalies. By learning structures within the data, whether based on time dependence or more general interactions between variables, these methods can effectively predict expected outcomes. This makes prediction-based methods highly adaptable, capable of working in diverse contexts, encompassing a wide range of data types.
In this section, we will explore three main methods for prediction-based anomaly detection: Recurrent Neural Networks (RNNs), Attention mechanisms, and Graph Neural Networks (GNNs).
4.4.3. Hybrid Approach
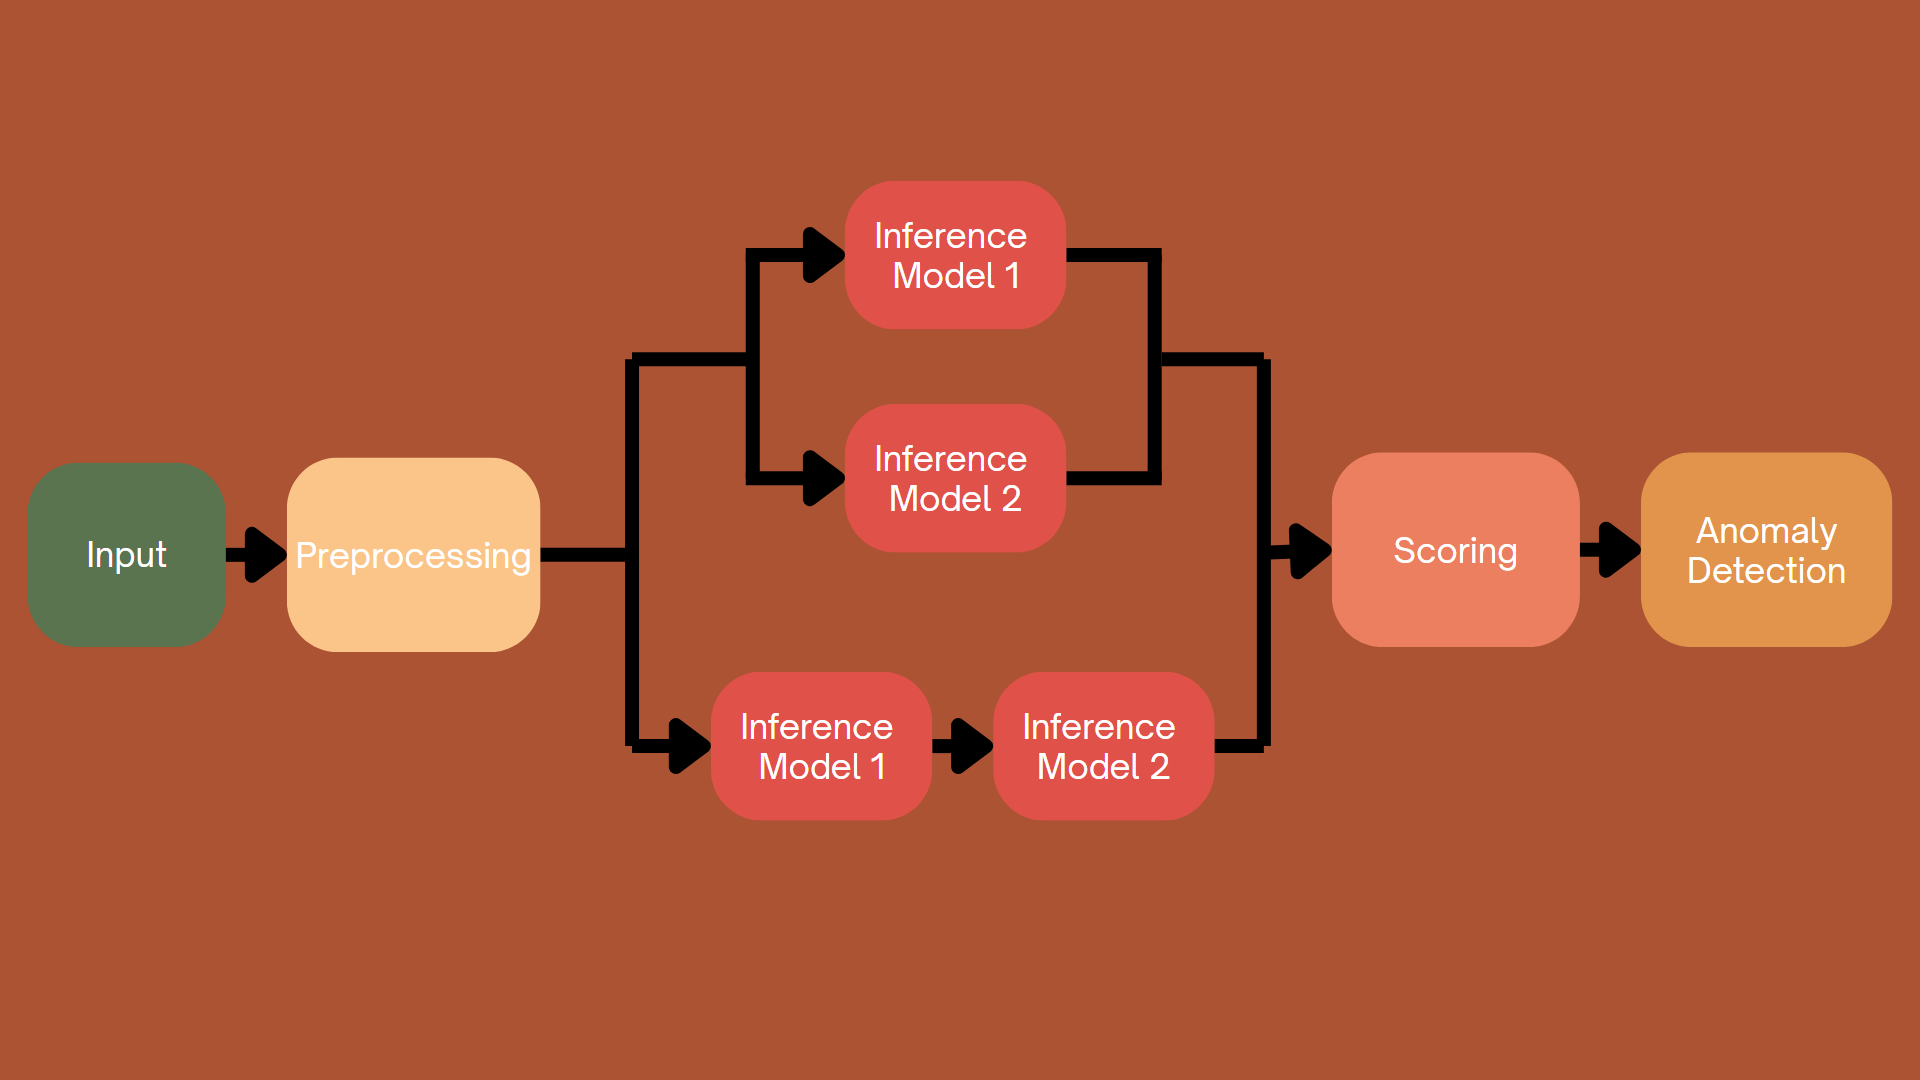 Figure 4.3. Hybrid Approach.
Methods based on reconstruction and prediction offer distinct but complementary approaches to identifying anomalies.
Reconstruction-based approaches focus on learning the underlying distribution of normal data. After training, the model attempts to reproduce the input data. This approach is particularly effective in cases where a thorough understanding of the data structure or distribution is required, such as in image-based anomaly detection or other multidimensional datasets.
Conversely, prediction-based approaches focus on forecasting specific attributes or missing values from the data, rather than reproducing the entire input. Predictive methods are often better suited to feature-rich datasets, where predicting specific variables can help identify anomalous patterns.
Although both methods differ in their approach to data processing, they can complement each other very well. In many cases, combining both allows for better anomaly detection. Reconstruction models capture the overall structure and information of the data, while predictive models focus on detecting deviations in specific variables or features. This combination can provide a more comprehensive solution for identifying anomalies in complex datasets across various domains.
Specifically, to detect anomalies, you can use results from both reconstruction models and prediction models; and you can also use the results obtained by running the data sequentially through the prediction model and then the reconstruction model to enhance the results from the previous prediction model.
4.5. Combining Traditional Machine Learning and Deep Learning
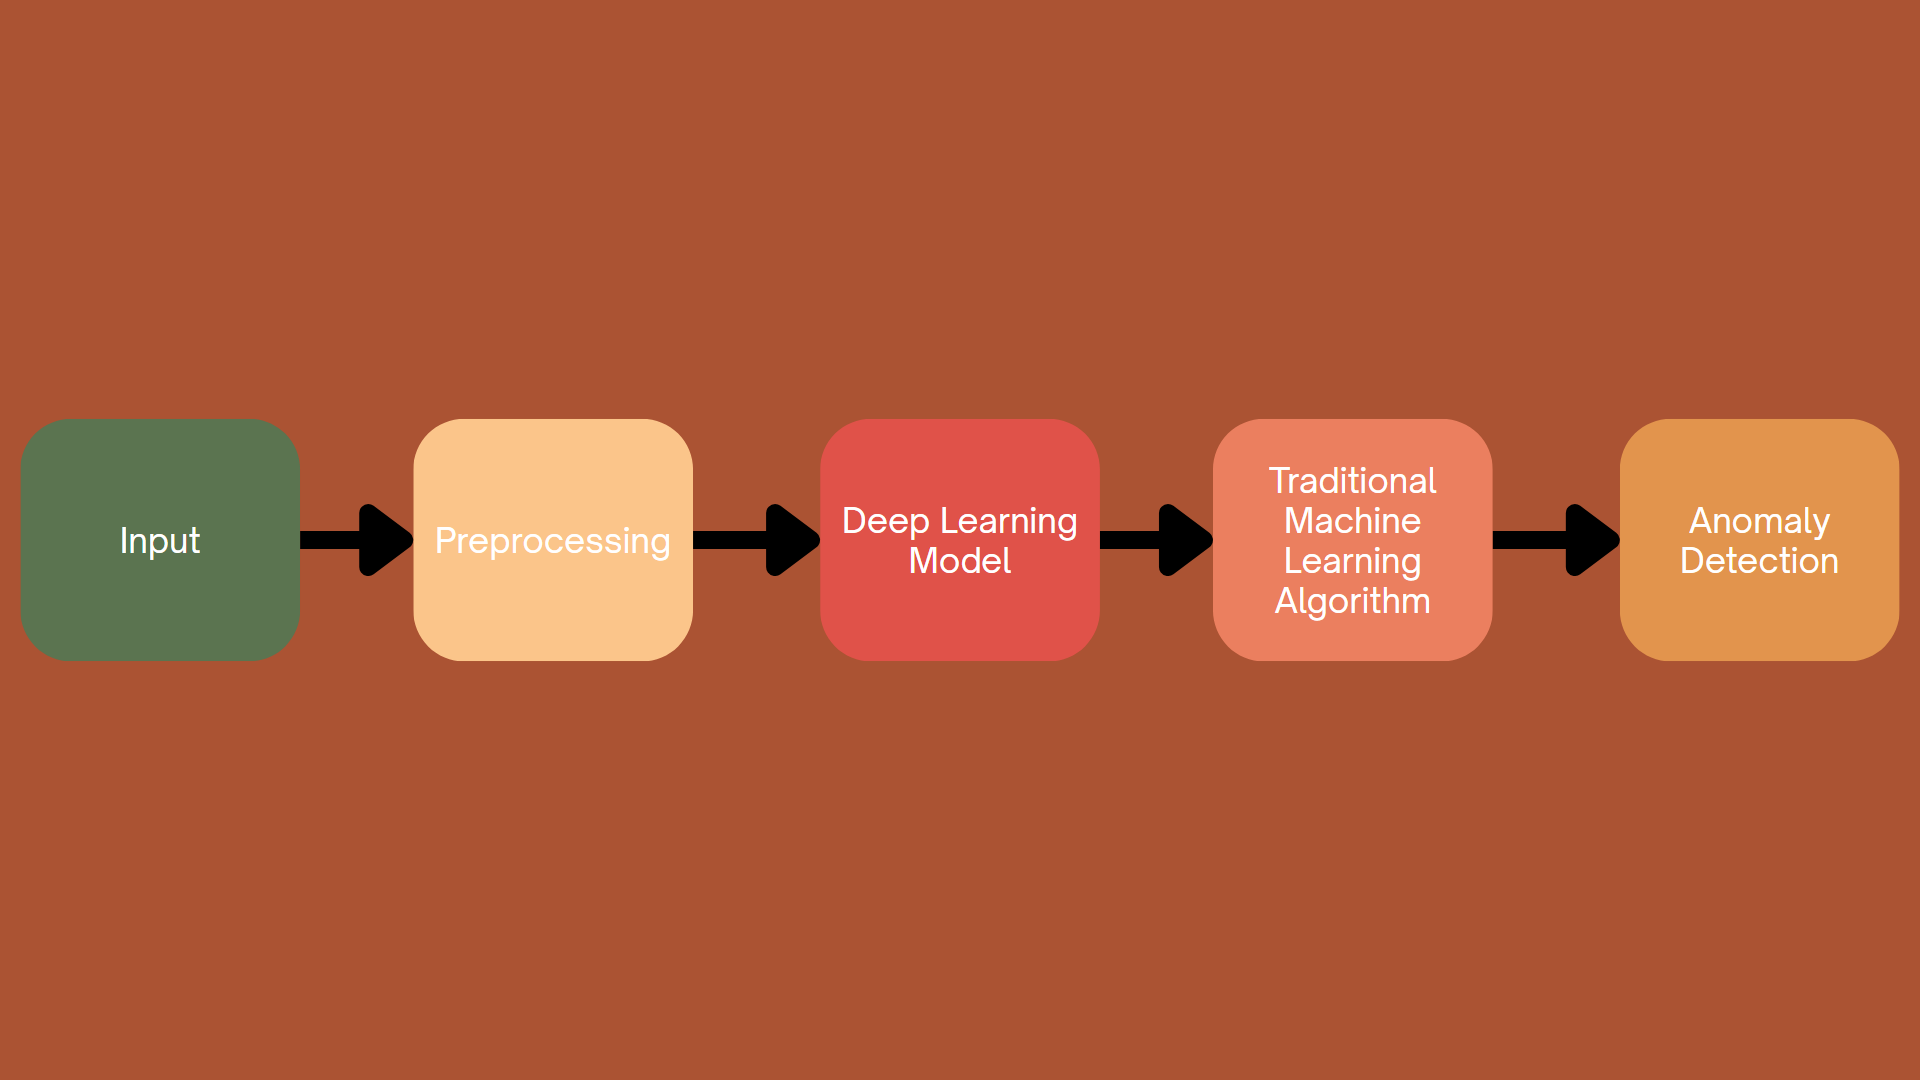 Figure 4.4. Combining Traditional Machine Learning and Deep Learning
Traditional and deep learning methods each offer distinct advantages. Traditional methods, such as clustering and support vector machines (SVMs), are generally simpler, easier to understand, and more computationally efficient. These methods excel at providing transparent decision-making processes, making them suitable for applications where model interpretability is critical. Deep learning methods, on the other hand, with their ability to model complex, multidimensional data distributions, offer enhanced detection accuracy and adaptability, particularly for large datasets and unstructured data such as images and sequences.
The integration of traditional and deep learning methods aims to leverage the explanatory power and simplicity of traditional methods with the robustness and flexibility of deep learning techniques. By combining these approaches, researchers seek to create hybrid models that maintain accuracy while providing deep insights into underlying decision-making processes, improving both the model's detectability and transparency.
In this approach, we typically use deep learning models to extract complex, multidimensional features; then, using algorithms such as clustering or support vector machines, we can classify and detect anomalies.
5. Challenges in Anomaly Detection
5.1 Imbalanced Data
One of the most common challenges in anomaly detection is imbalanced data.
In many real-world problems, anomalous data represents only a very small proportion of the total dataset. For example, in financial transaction data, fraudulent transactions typically account for only a tiny fraction of all transactions.
Example:
Normal transactions: 99,9%
Fraudulent transactions: 0,1%
This imbalance can cause traditional machine learning models to focus primarily on the majority class (normal data). As a result, a model may achieve very high accuracy while still failing to detect anomalies.
For instance, if a model predicts every transaction as normal, it could still achieve an accuracy of 99,9% in the example above, even though it fails to identify any fraudulent transactions.
To address this issue, data scientists often apply techniques such as sampling methods (e.g., oversampling the minority class) or employ specialized anomaly detection algorithms to improve the detection of rare events.
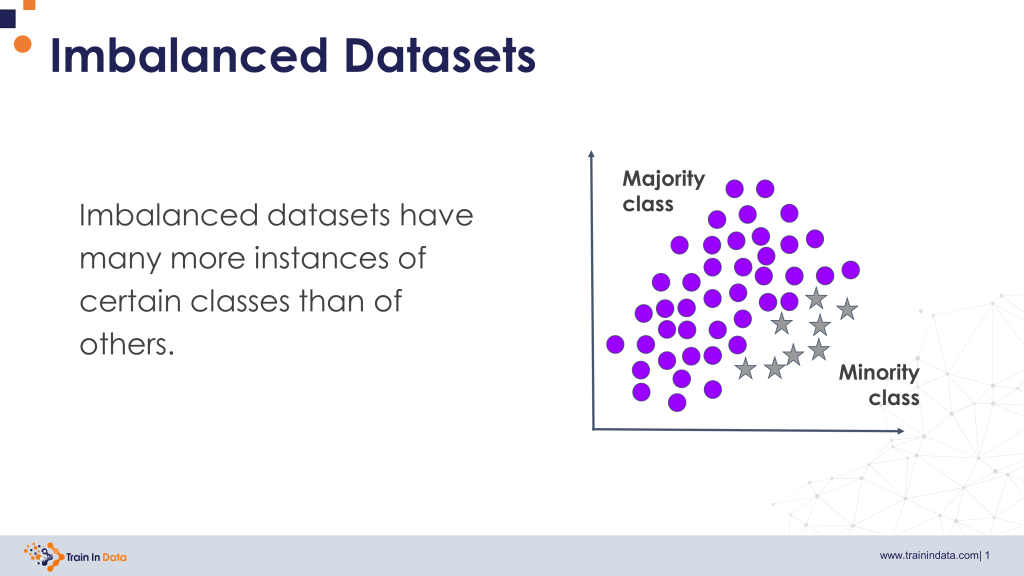 Figure 5.1. Imbalanced data; Source: Train In Data
5.2 Evolving Patterns
Another challenge is that anomalous behavior is not static and may change over time.
In machine learning, this phenomenon is commonly referred to as concept drift, where the statistical properties of the data evolve over time. When this occurs, models trained on historical data may become less effective when applied to new data.
A clear example can be observed in financial fraud detection systems. Fraudsters continuously modify their strategies in order to bypass security mechanisms. Once a particular fraud pattern becomes detectable and is blocked, attackers often develop new methods to carry out fraudulent activities.
As a result, real-world anomaly detection systems typically require:
-
continuous monitoring of model performance
-
regular updates with new data
-
periodic model retraining
These practices help ensure that the system remains effective in detecting anomalies within a constantly changing data environment.
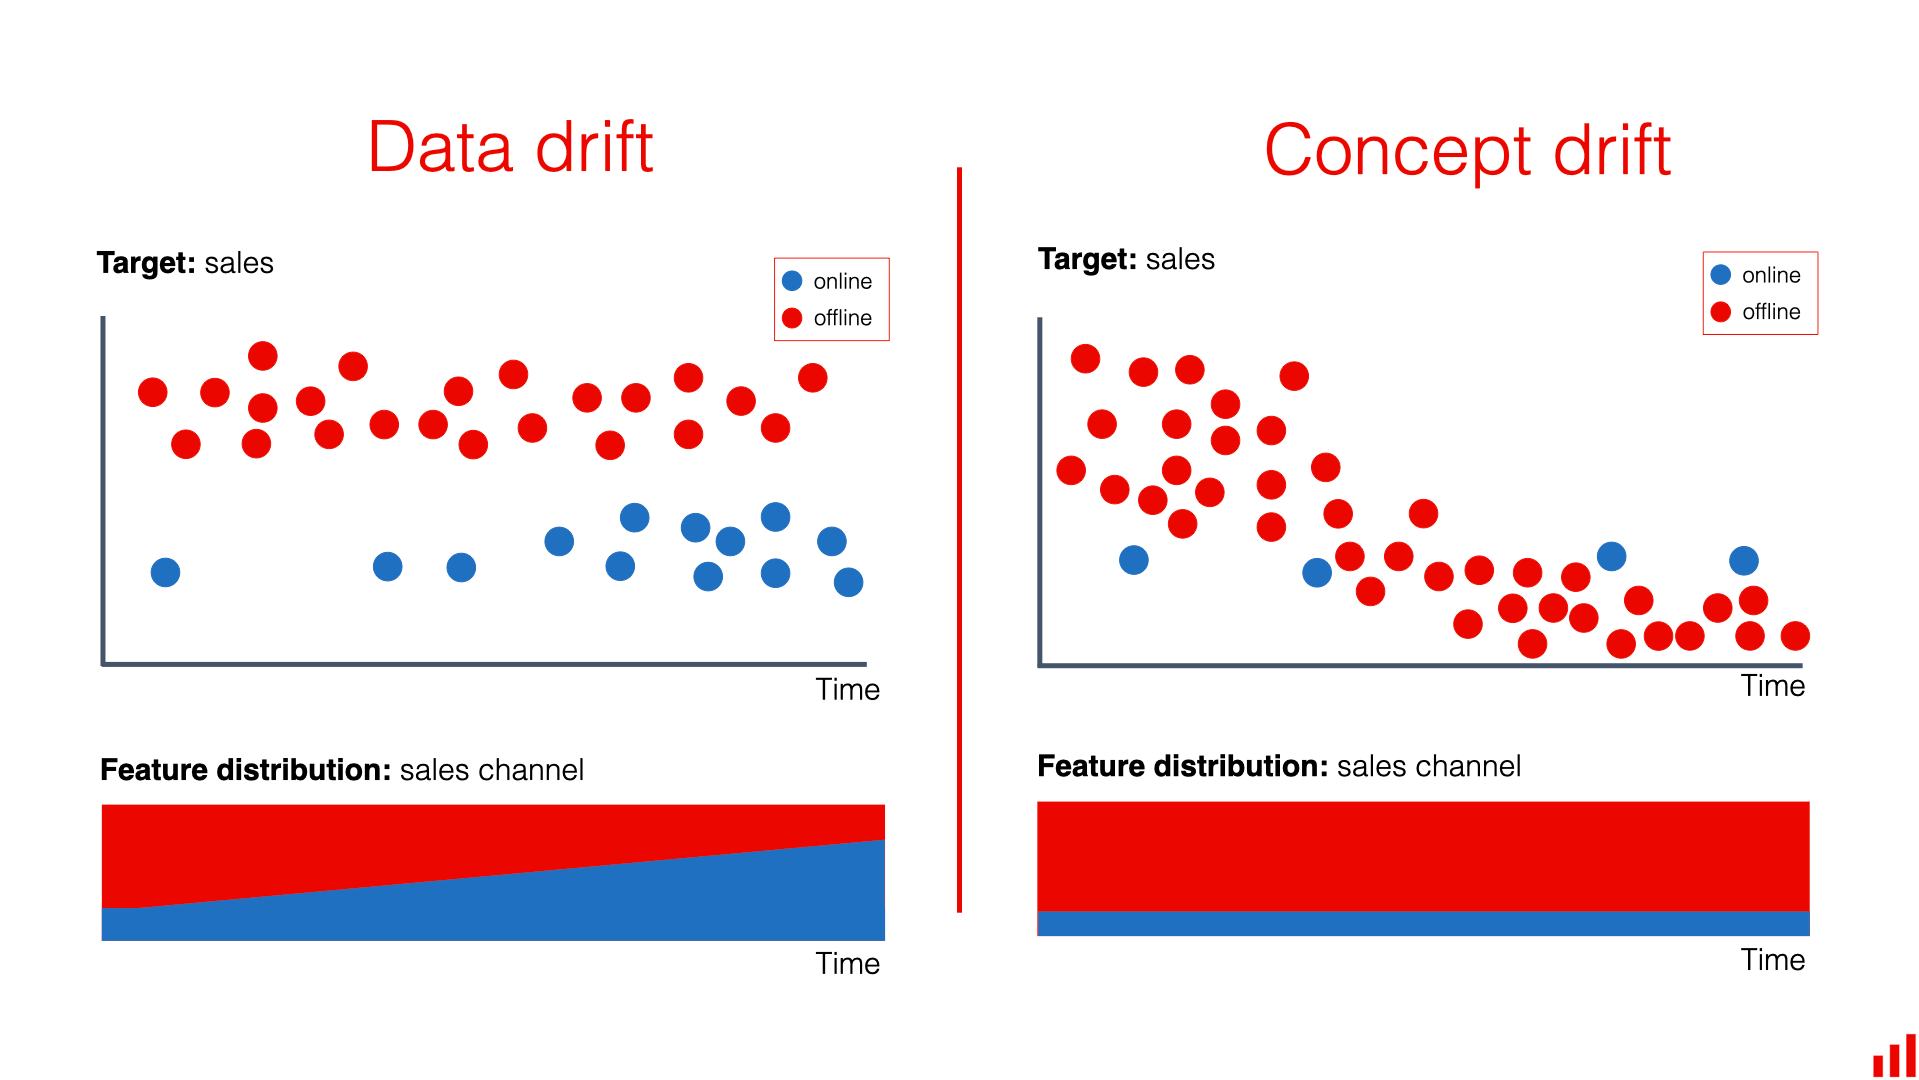 Figure 5.2. Evolving data patterns over time; Source: EVIDENTLY AI
5.3 High-Dimensional Data
Another challenge arises when datasets contain a large number of features.
For example, a transaction record may include several attributes such as:
-
transaction amount
-
transaction time
-
geographic location
-
device information
-
user behavior history
-
payment method
As the number of features increases, anomaly detection becomes more difficult due to a phenomenon known as the curse of dimensionality.
In high-dimensional spaces, the distance between data points becomes less meaningful. Data points may appear similarly distant from one another, making it harder for algorithms to distinguish between normal and anomalous behavior.
Additionally, high-dimensional datasets increase computational complexity and may contain irrelevant or noisy features that negatively affect model performance.
To address this issue, data scientists often apply techniques such as feature selection or dimensionality reduction, like Principal Component Analysis (PCA).
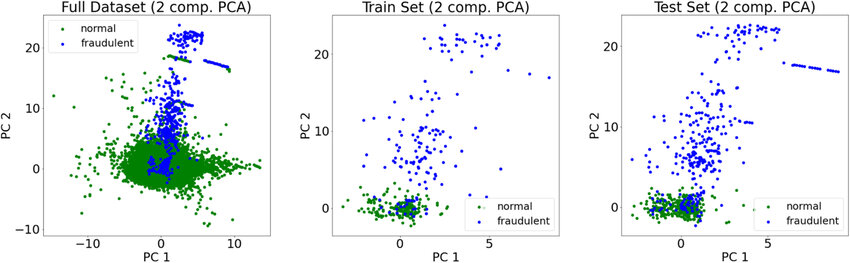 Figure 5.3. High-Dimensional data representation; Source: ResearchGate
5.4 Real-Time Detection Requirements
In many real-world applications, anomaly detection systems must operate in real time.
For example, in credit card fraud detection or cybersecurity systems, anomalies must be identified immediately in order to prevent potential damage. If detection occurs too late, the consequences can be significant.
Consider a scenario where a credit card is used in two geographically distant locations within a very short time interval. This unusual behavior may indicate a potential fraud attempt, and the system must quickly flag the transaction for further verification.
Therefore, anomaly detection systems must balance accuracy, processing speed, and computational cost, particularly when dealing with large-scale datasets or streaming data.
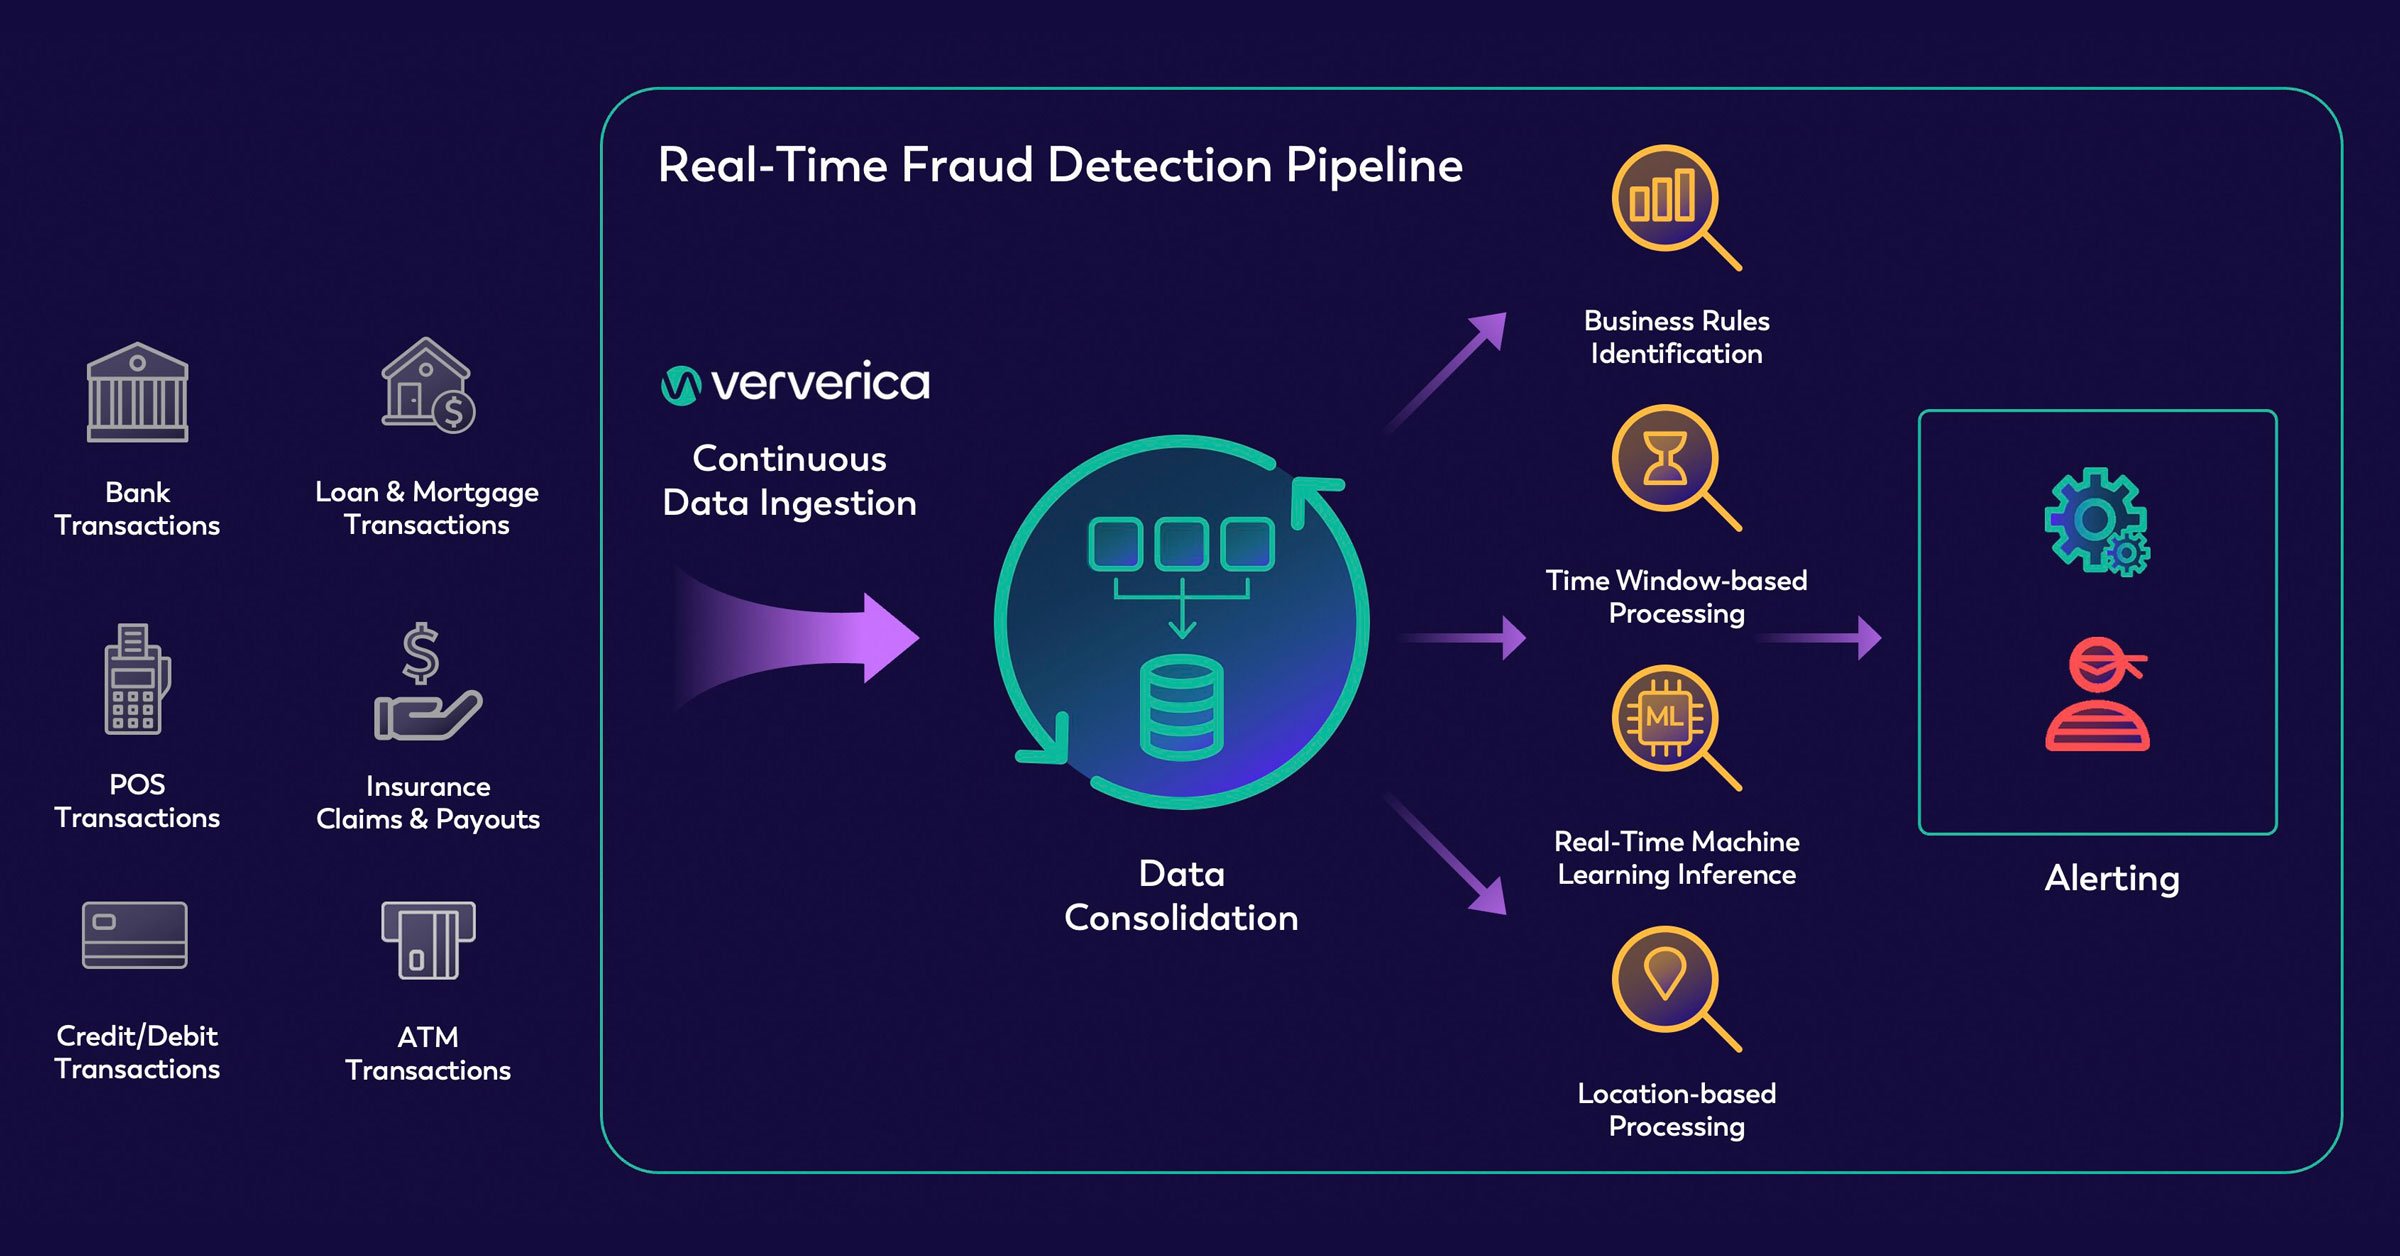 Figure 5.4. Real-time anomaly detection requirements; Source: ververica
6. Conclusion
The journey of decoding data is not just about finding similarities; it is about learning to listen to the signals that stand out. Anomaly Detection acts as the "sharp eye" that ensures Data Science systems don't miss critical moments—from stopping a sophisticated financial fraud to shielding digital infrastructure from hidden attacks.
Whether you utilize traditional statistical methods or modern Deep Learning architectures like Autoencoders and Isolation Forest, the ultimate goal remains the same: turning "black dots" of abnormality into precise, actionable decisions. But how do we bring these theories into the volatile, real-world banking industry? In our next post (Blog 2), we will go "hands-on" with specific Machine Learning techniques to build a Fraud Detection system for banks. Stay tuned!
References
Aggarwal, C. C. (2017). Outlier analysis (2nd ed.). Springer.
Chandola, V., Banerjee, A., & Kumar, V. (2009). Anomaly detection: A survey. ACM Computing Surveys, 41(3), 1–58. https://doi.org/10.1145/1541880.1541882
Goodfellow, I., Bengio, Y., & Courville, A. (2016). Deep learning. MIT Press.
Chandola, Banerjee, and Kumar (2009). Anomaly Detection: A Survey
Huang, H., Wang, P., et. al. (2025). Deep Learning Advancements in Anomaly Detection: A Comprehensive Survey. arXiv. https://arxiv.org/html/2503.13195v1
IBM. (n.d.). What is anomaly detection? IBM. https://www.ibm.com/think/topics/anomaly-detection
Nguyễn Minh Hải. (2025). Anomaly Detection là gì? Xu hướng phát triển của phát hiện bất thường. VNPT AI. https://vnptai.io/vi/blog/detail/anomaly-detection-la-gi
Song, X., Wu, M., Jermaine, C., & Ranka, S. (2007). Conditional anomaly detection. IEEE Transactions on Knowledge and Data Engineering, 19(5), 631–645. https://doi.org/10.1109/TKDE.2007.1018
Goldberger, A. L., Amaral, L. A. N., Glass, L., Hausdorff, J. M., Ivanov, P. C., Mark, R. G., Mietus, J. E., Moody, G. B., Peng, C.-K., & Stanley, H. E. (2000). PhysioBank, PhysioToolkit, and PhysioNet: Components of a new research resource for complex physiologic signals. Circulation, 101(23), e215–e220. https://doi.org/10.1161/01.CIR.101.23.e215
Chưa có bình luận nào. Hãy là người đầu tiên!