When you learn data cleaning, everything feels straightforward. Missing values? Fill or drop. Duplicates? Remove. Typos? Standardize.
It all seems logical. But once you step into real-world data, especially in domains like Human Resources (HR) - you realize something important:
Data isn’t always dirty. Sometimes, it’s just misunderstood.
And that’s where data cleaning becomes dangerous.
1. Basic data cleaning
Let’s start with a simple example dataset from Kaggle: a Cafe Sales Dataset.
Link Google Colab for full code: Data cleaning demo
We will follow 6-step data cleaning framework to clean this dataset.
1.1. Step 1: Dataset Exploration
Our goal in this step is understanding dataset structure.
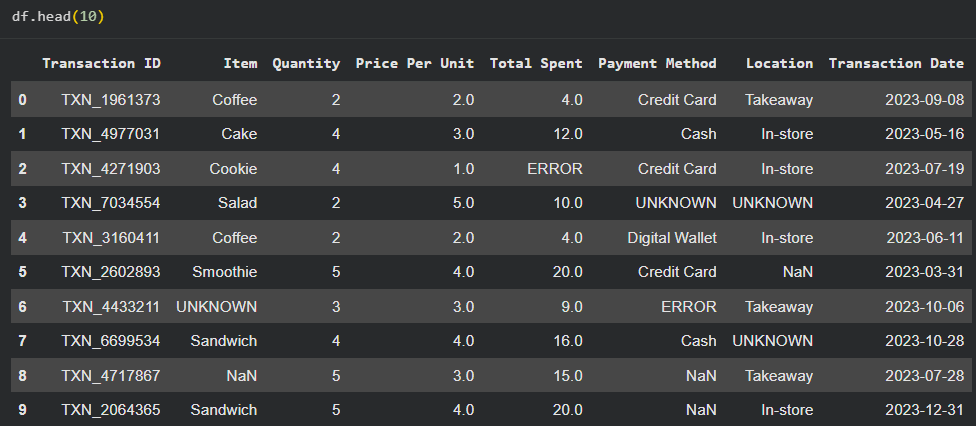
Figure: Example of the first 10 rows in the dataset.
We are going to check the following:
- Shape
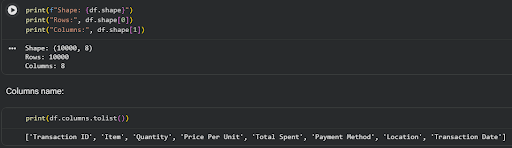
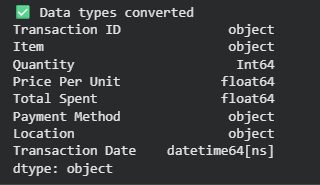
- Data types
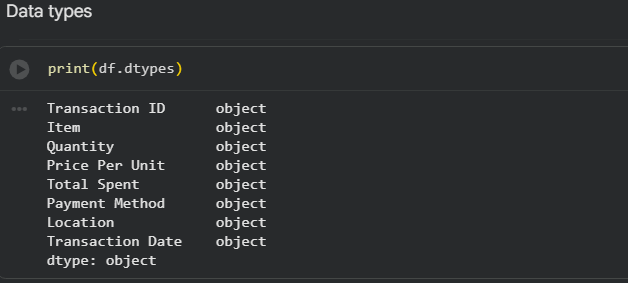
In this dataset, all columns have “object” data type because numeric values are mixed with string entries such as UNKNOWN and ERROR.
- Null percentage
- Unique values counts
- Basic statistics and distributions: We compute baseline statistics before cleaning. These will later be used to verify that the cleaning process does not distort the dataset.
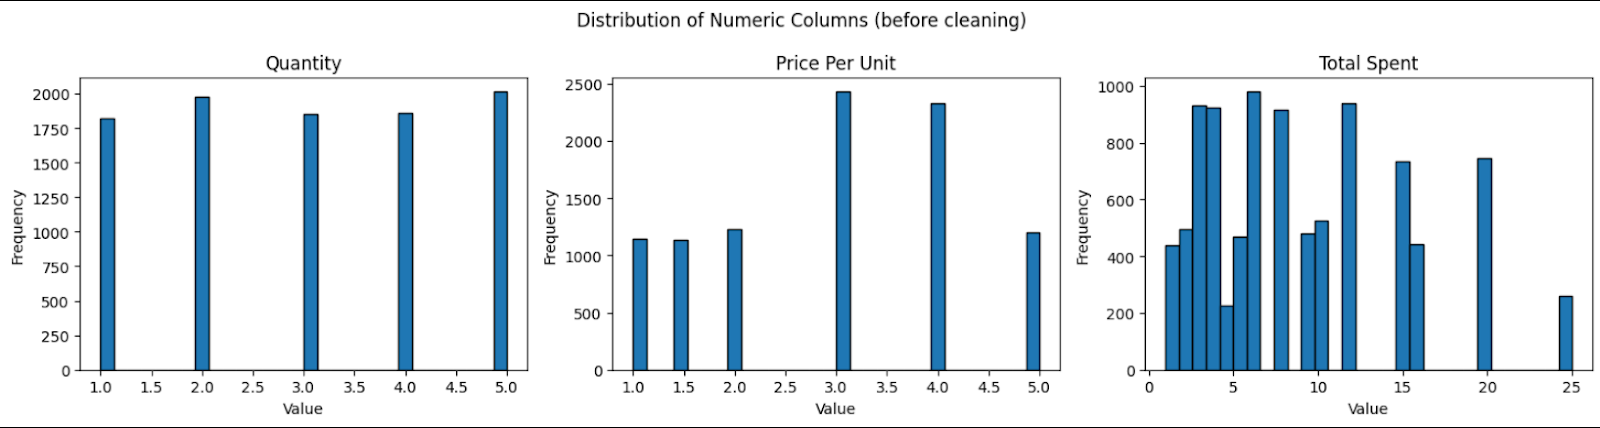
Figure: Dataset distribution before cleaning
Categorical Overview
- Transaction Date: spans from 2023-01-01 to 2023-12-31
- Item: Juice, Coffee, Salad, Cake, Sandwich, Smoothie, Cookie, Tea (plus noisy values)
- Payment Method: Digital Wallet, Credit Card, Cash (plus noisy values)
- Location: Takeaway, In-store (plus noisy values)
1.2. Step 2: Define quality rules
Assume the goal is tracking revenue over time. Therefore, we prioritize:
- Item
- Quantity
- Price Per Unit
- Total Spent
Key decisions:
- Transaction ID → no missing values, safe
- Payment Method & Location → too many missing values → acceptable to standardize as "Unknown"
- Transaction Date → may use forward/backward fill if appropriate
1.3. Step 3: Handle missing values
1.3.1. Convert invalid values to NaN
First, we convert all UNKNOWN and ERROR values to NaN while also copying the original dataset for comparison.
df_clean = df.copy()
df_clean.replace(['UNKNOWN', 'ERROR'], np.nan, inplace=True)
1.3.2. Analyzing missing patterns
Then, we utilize the “missingno” library to visualize missing patterns of columns. Next, we check the missing pattern by using “pyampute” library or defining a function. This dataset follows MCAR missing pattern, so a naive approach would be to drop rows with missing values, but this would result in losing ~14% of the data, which is inefficient.

Figure: Result after using pyampute
1.3.3. Use domain logic to recover missing values
We observe the relationship: Total spent = Price per unit x Quantity. So if any two of the three values exist, the third can be computed.
Strategy:
- If only one value is missing → compute it
- If two or more values are missing → drop the row
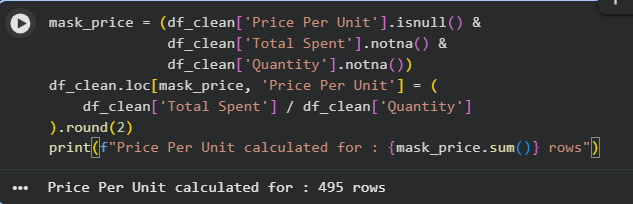
Figure: Price Per Unit calculation
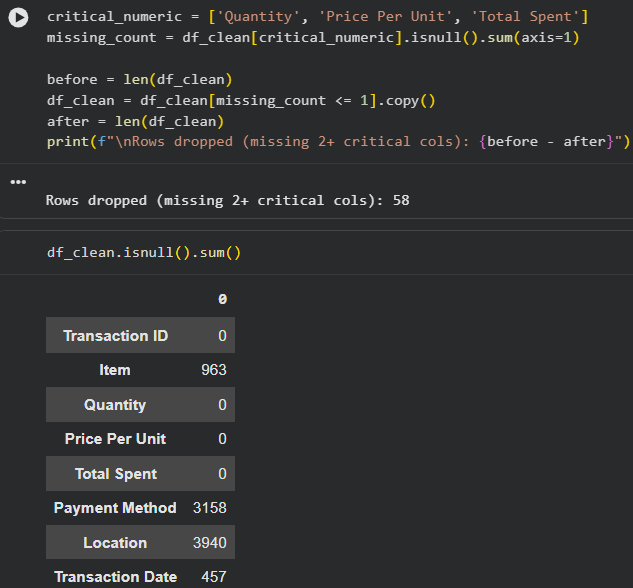
Figure: Drop missing value rows
Result:
- Only 58 rows dropped
- All numeric columns successfully cleaned
1.3.4. Impute missing Item values
Approach:
- Compute mean price per unit for each item
- For rows with missing Item:
- Find the closest mean price
- Assign the corresponding item
If there are multiple items with the same mean, we choose the item with higher frequency.
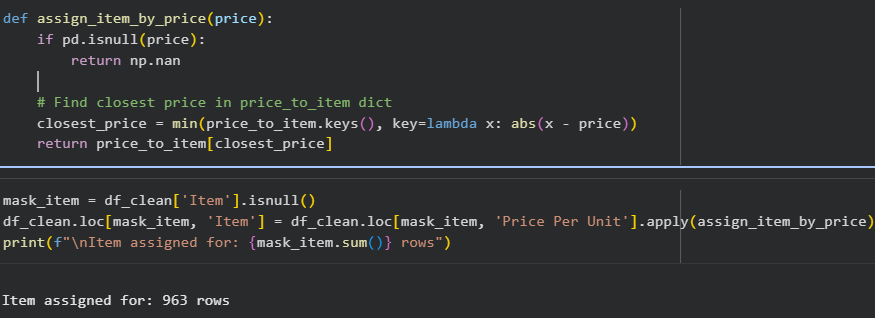
Figure: Result: all 963 missing Item values are successfully imputed
1.3.5. Handle remaining columns
- Location and Payment Method: replacing invalid values with “Unknown”
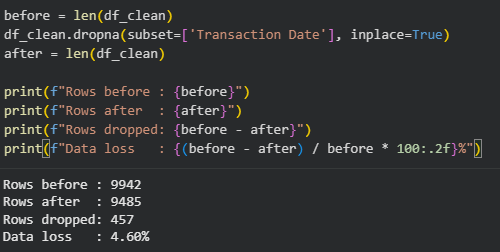
- Transaction date: Since this dataset is not sorted chronological, we can have 2 options:
- Drop missing rows (~4.5%)
- Sort and fill, which may distort time series
We choose the first approach.
After this step, we check the dataset statistic after cleaning:
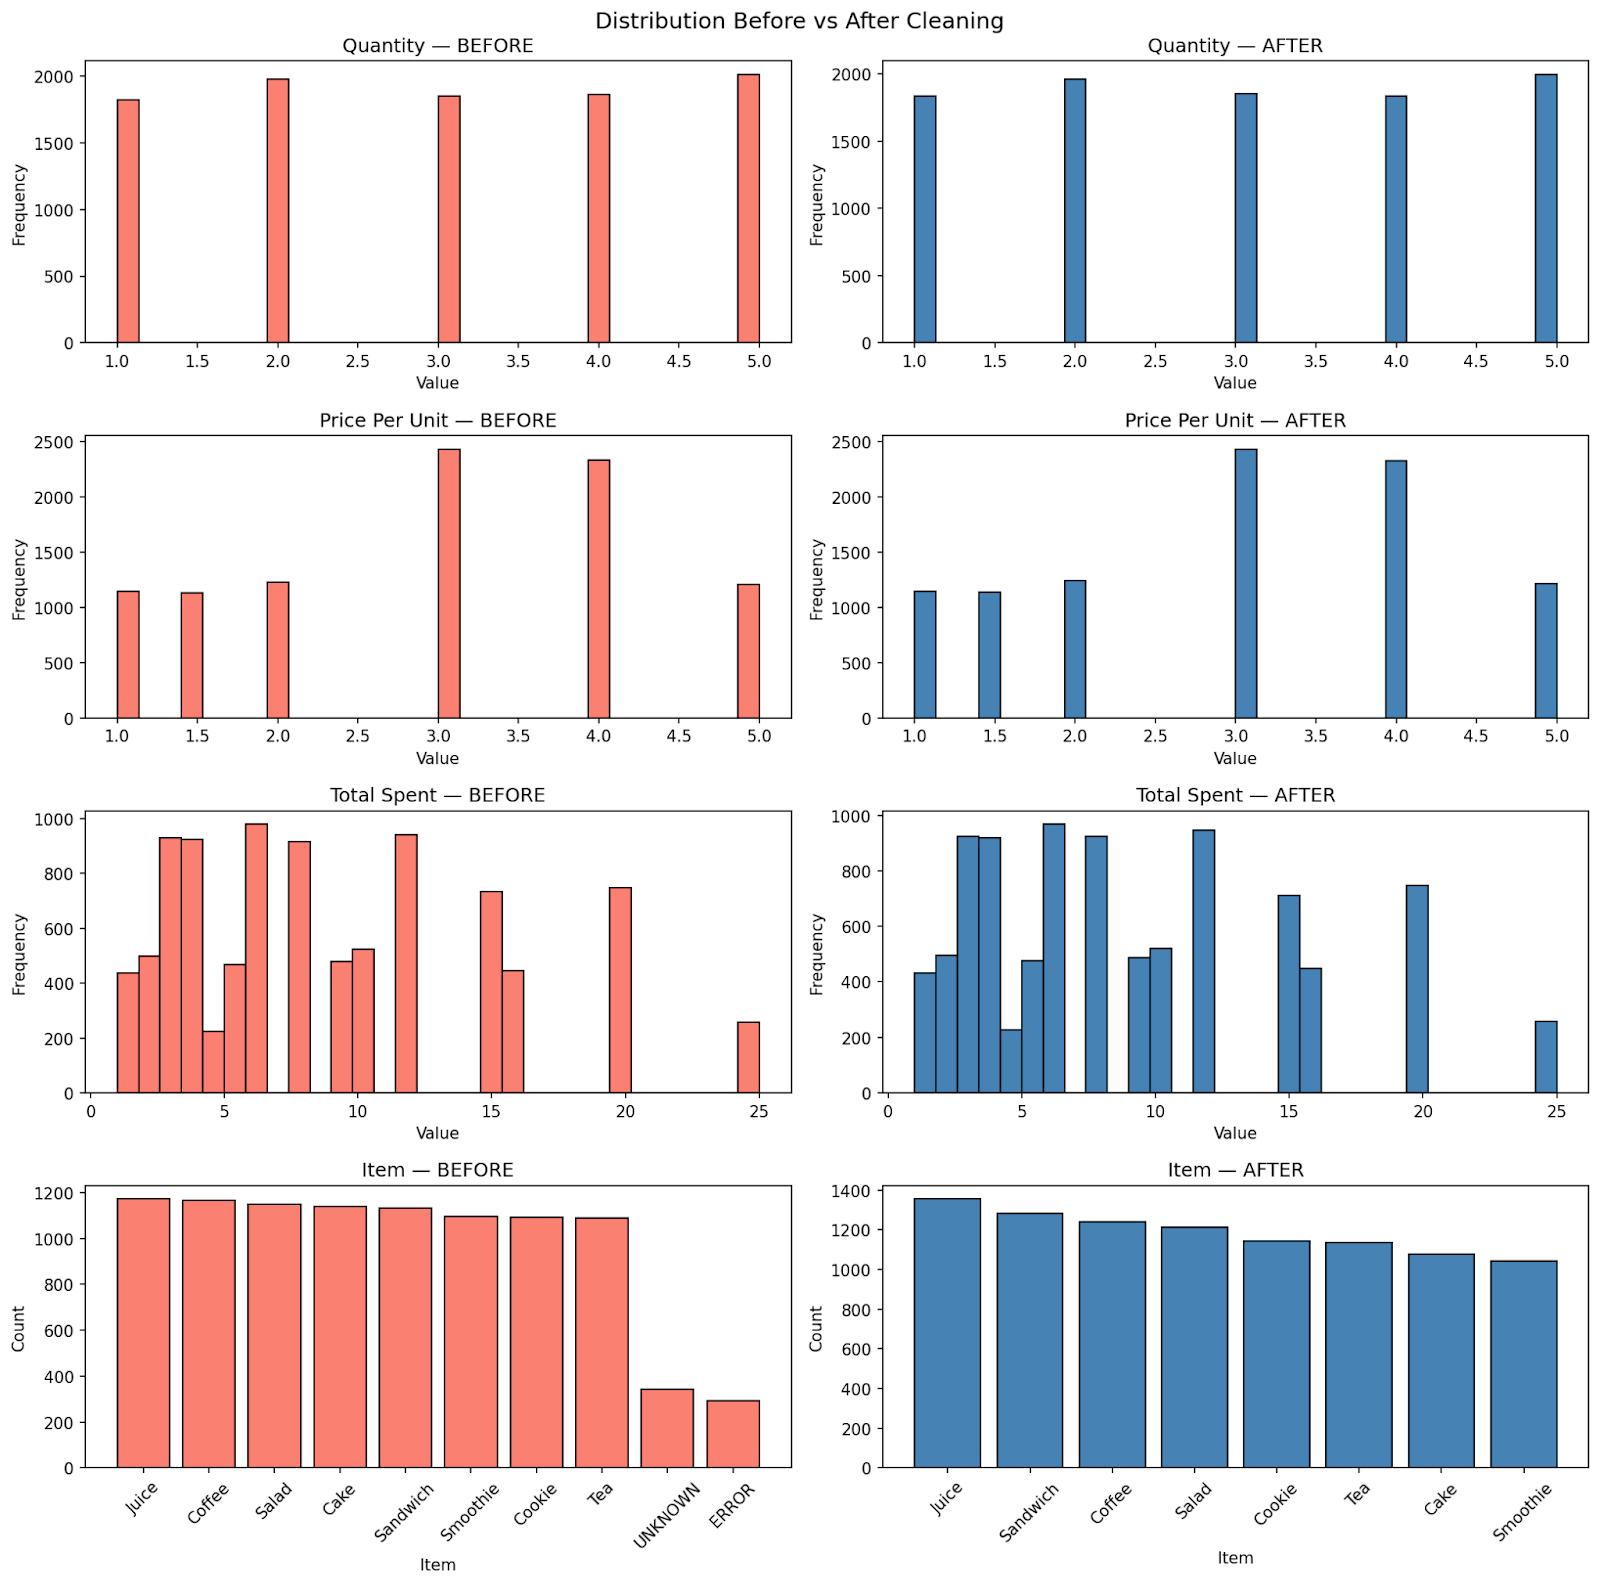
Figure: Dataset shape remains the same after cleaning
1.4. Step 4: Standardize & Transform
- Text standardization:
text_cols = ['Item', 'Payment Method', 'Location']
for col in text_cols:
    df_clean[col] = df_clean[col].str.strip().str.title()
- Numerical standardization
1.5. Step 5: Deduplicate
Dataset has no duplicated rows, so we do nothing in this step.
1.6. Step 6: Validate & Document
After cleaning, only 5.15% of the dataset is removed while statistical properties remain consistent. By understanding the meanings of each column, we don’t blindly drop missing values, instead, we leverage relationships within the data to recover information.
In this environment, cleaning is mostly about applying rules - and the data behaves predictably. But this is also where the limitation becomes clear. Because not all data behaves this way. When we move from structured, transactional datasets to real-world domains like HR, the same rules no longer apply. Data cleaning in the real world is fundamentally different.
2. Data cleaning in real world - HR dataset
Now, let's move to HR dataset.
2.1. 3 Key patterns of HR data
- Fragmented Data Sources: Data is rarely in one place. It flows from external salary surveys (conducted by vendors like Mercer, Willis Towers Watson, or Radford) and internal company systems. We have to reconcile "Internal" (employee records) with "External" (market benchmarks), which rarely use the same formatting.
- The Interpretation Trap: Unlike classifying "cats vs. dogs," HR data is subjective. For example, a recruiter might label a candidate as an "AI Engineer," expecting them to handle everything from Web-dev and APIs to Cloud pipelines. A single job title can have a dozen different interpretations depending on who is looking at it. It’s a big and beautiful mess!
- The Privacy Perimeter: HR files contain your most sensitive information—names, home addresses, salaries, and benefits. Passing this data around freely isn't just a "bad look"; it’s often illegal. Protecting Personally Identifiable Information (PII) is the first and most critical step in any HR data workflow.
Because of these patterns, companies must develop specialized cleaning processes to ensure they stay compliant with the law without turning their analysis into a nightmare. This isn't just about being tidy; it's about survival.
2.2. Building the Digital Shield
In HR, data cleaning begins with a heavy focus on security and compliance. While many people think of "cleaning" as simply fixing typos or removing duplicates, in our field, it almost always starts with Anonymization. Because HR records contain sensitive details like home addresses, bank accounts, and salaries, we have to scrub or hide personal identifiers before the data is even touched for analysis.
This process is largely driven by strict legal requirements. Regulations like GDPR in Europe, the CCPA in California, and local labor laws here in Ho Chi Minh City dictate how we handle this information. Under GDPR, for instance, we have to account for the "Right to be Forgotten." This means our cleaning workflow must be able to permanently delete an individual’s personal details if they leave the company, while still allowing us to keep the high-level historical trends for the business.
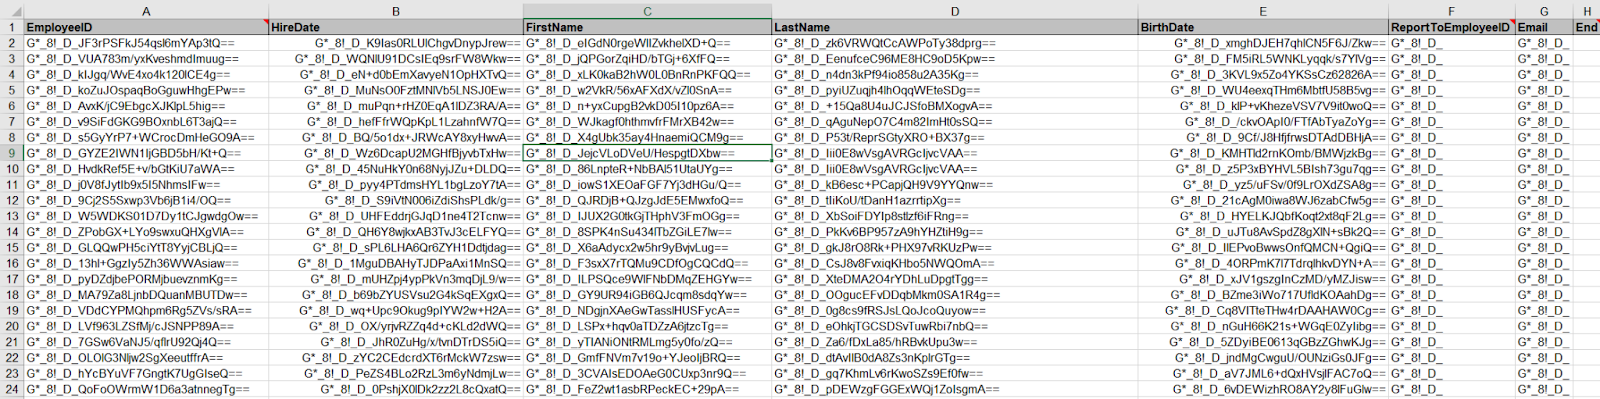
In a practical, day-to-day setting, this usually involves Encryption. Most companies use standards like AES-256 to scramble fields like names, emails, and government IDs. Instead of working with a person’s actual name, we work with an encrypted "token" or a randomized ID. This is a real example of how PII works. All the fields “EmployeeID”, “HireDate”, “FirstName”, “LastName”, “BirthDate”, “ReportToEmployeeID” and “Email” are PII fields, and they are purposefully hidden behind these encryptions.
Doing this early in the process serves two purposes:
- It ensures the company remains legally compliant in case of a data breach.
- It helps prevent unconscious bias. When an analyst is looking at pay equity or promotion rates, they can focus purely on the numbers and qualifications without being influenced by knowing exactly which colleague the data belongs to.
2.3. Understanding the Context: Spotting the Abnormalities
Many junior analysts only learned about the tools, they need to understand the industry they are working in as well. In HR, time doesn't just flow linearly. Records have an Effective Date, and cleaning them requires a process called Point-in-Time Reconciliation.
Imagine this scenario: an employee gets a raise on March 1st, but the manager doesn't enter it into the system until March 10th. If you pull a "current" report on March 5th, what is that employee’s salary? The old one.
The "dirty" data we have to fix is called Overlapping Records. Without strict cleaning logic and industry knowledge, the same employee might show up twice in your headcount report: once with their old job title (active until Feb 28th) and again with their new one (effective March 1st). Our cleaning process must be sophisticated enough to identify and remove the outdated record based on the effective date. If you ignore the Effective Date, your headcount will be wrong, your budget reports will explode, and you’ll have a chaotic mess that no formula can fix.
Effective date (or publication date) is often used in some big vendor reports to classify the date of their data. These are updated quarterly, and are the most important piece of information to understand before conducting any tasks.
In HR, you have to be highly sensitive to the environment the data comes from. For instance, you might see two employees with the same job title, but one is making significantly more than the other. Before you assume it’s an error and "clean" it, you have to look at the Cost of Labor. An employee working in a high-cost hub like Boston or San Francisco will naturally yield a higher salary than someone in a suburban area or a smaller city. If you don't understand these geographic nuances, you might mistakenly flag legitimate pay differences as data entries that need "fixing."
Another common trap is Currency Confusion. In global companies, it is very common for a client or manager to type an abnormally large amount into a spreadsheet. If you see a salary of 2,000,000,000 listed under "USD," your intuition should immediately kick in. It’s highly likely that the amount was actually entered in VND (Vietnamese Dong) but categorized under the wrong currency code. Without being sensitive to these specific business contexts, you risk producing reports that are wildly inaccurate.
2.4. Standardizing the "Human Factor"
The standard "cats vs. dogs" cleaning advice from school works because cats are always cats. But in HR, we face the challenge of subjective standardization. As mentioned, what one manager calls a "Junior Developer," another calls an "Associate Programmer." This is where the "art" of cleaning happens. You can't just run a script that renames every instance of "Wizard" to "Specialist" because those words might mean different things to different departments. This is why you must communicate with stakeholders constantly before you hit "delete" or "replace."
Imagine you are cleaning a list of job titles to help a company understand their hiring needs. You see twenty different titles that all look like "Administrative Assistant." Your instinct might be to consolidate them all into one single category to make the data look "cleaner." However, if you don't check with the department heads first, you might miss a crucial detail: perhaps ten of those people are executive-level assistants who require specialized legal knowledge, while the other ten are general office support. If you "clean" them into one bucket without asking, you’ve just made it impossible for the company to see that they are actually underpaying their legal specialists.
Some companies can divide the levels of their employees into different categories. This can vary from A-level (Associate), P-level (Professionals) to M-level (Management) or even E-level (Education, think of it as your school professors). If we don’t understand these rules and structures, we will make fatal mistakes in our cleaning process and reports.
The cleaning process in HR isn't just about making the spreadsheet look neat; it’s about ensuring the categories make sense for the people using them. A "clean" dataset is only useful if it accurately reflects the roles and responsibilities of the actual human beings in the office.
2.5. The Tooling Reality Check
You might spend years learning SQL, Python, or advanced AI in college, but once you step into an HR office, you are confronted with a stark reality:
Excel is still the undisputed King.
The reality is that HR datasets are usually small-to-medium sized. A standard payroll file might only have a few thousand rows. We don’t always need "big data" tools to process these requests, but someone capable of making friends with spreadsheets. While tools like VBA, Macros, or Power Query exist white working on some processes, they are often the exception, not the rule. Learning a tool at school is a different thing than applying it in the real world.
In our daily workflow, we rely heavily on core functions like XLOOKUP, IFS, and text manipulators like LEFT, RIGHT, and CONCAT. We also use specialized add-ins like ASAP Utilities to speed up repetitive tasks that would otherwise take hours.
Through my experience as an HR Data Analyst, I’ve found that the most critical cleaning steps aren't fancy, they are foundational:
- Stripping Invisible Clutter: We strictly remove special characters like tabs, linefeeds, or carriage returns. These "invisible" characters can break your formulas and make a perfectly written VLOOKUP fail for no apparent reason.
- The "General" Rule for Currencies: We ensure data types are correct, specifically for money. We often keep currencies in General format rather than "Currency" format because commas can be misinterpreted as text by other reporting tools, leading to massive calculation errors.
- The Zero-Tolerance for Gaps: When we find empty data, we don't just "fill it in." In HR, a blank cell can mean anything from a system error to a sensitive legal status. We almost always report these gaps to management before making any changes.
- Hunting for "Impossible" Duplicates: It is logically impossible for an employee to have two different base salaries for the same job at the same time. We use Conditional Formatting to highlight these duplicates and then start a conversation with the source department to find out which record is the "truth."
- The Intuition Check: Finally, we look for abnormalities. This is where your intuition as an analyst comes in. Does the salary look too high for that region? Is a start date set in the future? This requires a human eye and constant communication.
- Template Constraints: The data has to be cleaned to fit a specific "Upload Template" where even one extra space in a cell will cause the whole system to reject the file. Often, your clients will not even follow the Template given to them.
- Audit Trails: Always backup, keep a raw version and a clean version of your work. In HR, if someone asks why an employee's salary was changed in a report, you need to be able to show the step-by-step logic of how you cleaned it.
3. The real gap between data cleaning in textbooks vs real-world
All of this leads to a much bigger realization. The difference between data cleaning in textbooks and in the real world is not about tools.
It’s about understanding data vs processing data.
| What you learn | What actually happens |
|---|---|
| Data is structured | Data is contextual |
| Missing can be fixed | Missing can be meaningful |
| Duplicate is error | Duplicate is history |
| Clean = Correct | Clean can mislead |
4. Conclusion
Data cleaning is often taught as a technical process - something you do to “fix” messy data. But in reality, it’s much more than that.
It’s a process of making decisions:
- What to keep
- What to remove,
- What to trust,
and most importantly, what not to change.
Because every dataset is a reflection of the real world. And the real world is rarely clean, consistent, or perfectly structured. The goal of data cleaning is not to make data look perfect. It’s to make data usable - without losing its meaning. In simple datasets, this is straightforward. In real-world domains like HR, it requires context, communication, and careful judgment.
And if there’s one thing to remember, it’s this:
The biggest risk in data cleaning is not messy data - it’s confidently cleaning it the wrong way.
Chưa có bình luận nào. Hãy là người đầu tiên!